Real Estate Marketing Donut Chart – Market Share Analysis
RJ0900002_12
- Last Update 08/15/2025
- File Size 0.1MB
- # of Slides 2
- File Format PPTX
- Slide Ratio 16:9
- Color
Keywords
- #Content-Based Slides
- #Design-Based Slides
- #Market and Competitor Analysis
- #Marketing Plan and Strategy
- #Diagram
- #Graph
- #Market Share
- #Key Marketing Activities
- #Spread
- #Circles
- #Centralized Diagram
- #Doughnut Chart
- #16:9
- #donut chart PowerPoint slide
- #pie chart presentation template
- #market share analysis PPT
- #data visualization slides
- #real estate marketing presentation
About the Product
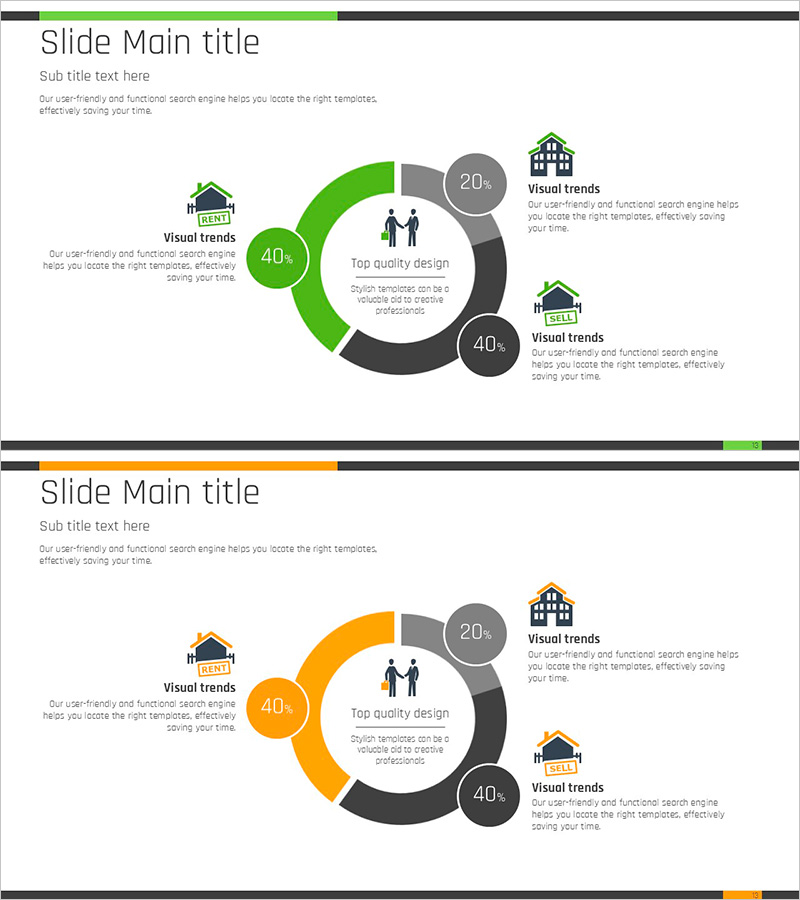
A professional donut chart PowerPoint slide designed for real estate marketing and market analysis presentations. The 4-segment structure in green and gray tones enables clear visualization of market share, sales distribution, customer segments, and regional revenue composition. Each segment displays percentage values with accompanying description text, while the central circular space accommodates key messaging or titles. Two color variations (green and orange) provide flexibility for diverse presentation scenarios, and the 16:9 widescreen format ensures compatibility with modern presentation environments. Delivered as an editable PPTX file, allowing immediate customization and deployment with your actual data.
Usage Points
-
Main Usage
Optimized for displaying four concurrent ratio datasets such as real estate market share, sales distribution by property type, customer segment composition, and regional revenue breakdown. The central circular space emphasizes key titles like 'Market Analysis', 'Sales Performance', or 'Customer Composition' for maximum visual impact.
-
How to Use
Replace percentage values in each segment with your actual data and populate the right-side text areas with corresponding descriptions (e.g., Apartments 40%, Officetel 20%, Commercial 40%). Colors are fully customizable based on data priority or category importance, and icons can be added to reinforce each segment's meaning.
-
Recommended For
Ideal for real estate agency market analysis presentations, construction company sales reports, marketing team customer segmentation analysis, investor pitch meetings, and regional real estate market trend briefings. Suitable for sales managers, marketing strategists, and executive-level reporting.
-
Slide Structure
Donut-shaped layout with four arc segments radiating from a central circular space. Each segment displays percentage values (20%, 40%, etc.), with three text description areas positioned on the right alongside icons. Includes two slide variations: green-gray tone base and orange-gray tone alternative, both in 16:9 format.
Related Products
-

Diagram Slide for Vehicle Brakes and Seats Explanation
#Business Strategy #Market and Competitor Analysis #Diagram
-

Food Nutrient Diagram – Market Share and Status Analysis
#Market and Competitor Analysis #Graph #Market Status
-

Market Share Donut Chart for Eco-Friendly Businesses – Trends and Insights
#Market and Competitor Analysis #Graph #Market Share
-

Analysis of Customer Preference for Eco-Friendly Business Donut Chart
#Market and Competitor Analysis #Diagram #Graph
