Navy Yellow Table Chart – Visualizing Financial Planning
RJ0900001_26
- Last Update 08/15/2025
- File Size 0.1MB
- # of Slides 2
- File Format PPTX
- Slide Ratio 16:9
- Color
Keywords
About the Product
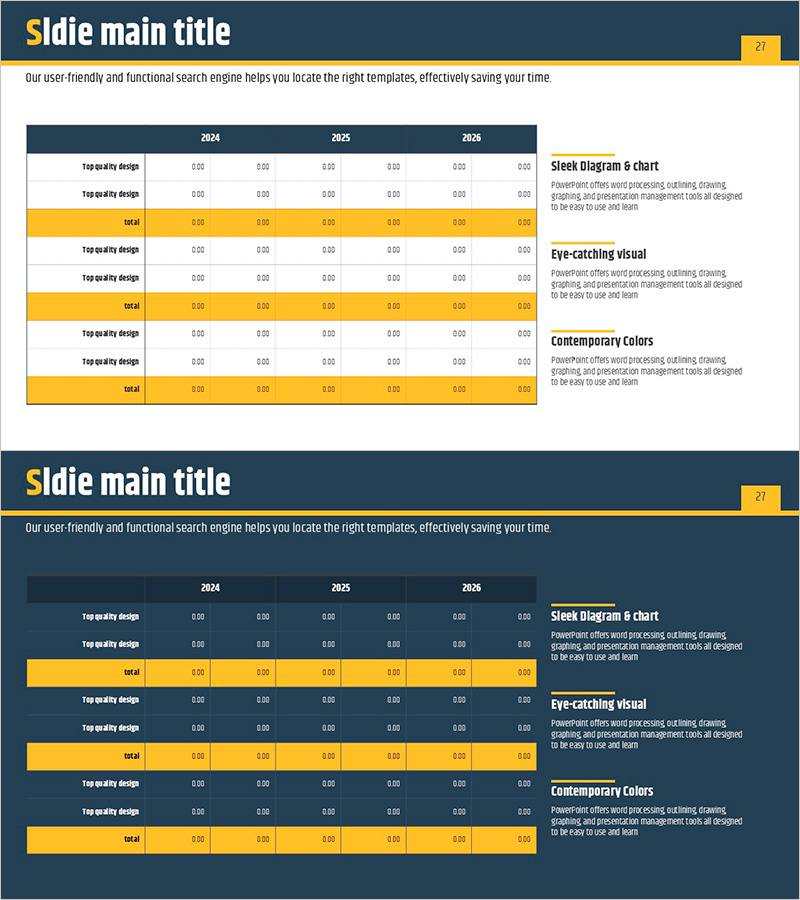
A professional table chart PowerPoint slide designed to visualize financial data and performance metrics with clarity. This 2-slide deck features a navy background with yellow accent colors, presenting year-over-year financial indicators (2024–2026) in a structured row-and-column format for easy comparative analysis. The upper title area and right-side description box allow you to highlight key insights, making it ideal for investor presentations, financial reports, and budget planning decks. Formatted in 16:9 widescreen PPTX, it's fully editable across all presentation software and ready for immediate use in financial planning and ROI discussions.
Usage Points
-
Main Usage
This slide is designed for business plans, investor pitch decks, and financial reports where year-over-year financial metrics (revenue, expenses, profit margins, cash flow) require comparative analysis. The navy background conveys financial credibility while the yellow accent draws attention to critical figures, supporting data-driven decision-making.
-
How to Use
Enter your analysis topic in the title area (e.g., 3-Year Financial Forecast, ROI Comparison). Populate the table cells with year-by-year and category-specific figures. Use the right-side description box to summarize key insights or performance highlights, enhancing audience comprehension. The yellow-highlighted total row emphasizes cumulative values or final results.
-
Recommended For
CFOs, finance managers, and executives presenting to investors, shareholders, and stakeholders. Ideal for quarterly and annual financial reviews, budget allocation explanations, investment return analysis, and any scenario requiring data-backed financial decision-making.
-
Slide Structure
Two-slide layout with each slide containing a title area (1 row), central data table (6 rows × 7 columns base structure), and right-side description box (3 sections). Table rows organize item names, year-by-year data, and totals, with yellow-highlighted rows visually distinguishing critical metrics.
Related Products
-

3D Shape Template Table for Financial Performance
#Financial Plans and Performance #Diagram #Projected Return on Investment (ROI)
-

Volume Presentation Template - Laptop Mockup and Table Chart for Modern Proposals
#Financial Plans and Performance #Diagram #Other
-

Denim PPT Table Chart – Clearly Presenting Financial Performance
#Financial Plans and Performance #Diagram #Cash Flow Statement
-

Square Frame Infographic Elements Slide – Perfect Combination of Business Vision and Financial Planning
#Business Vision and Strategy #Financial Plans and Performance #Diagram
