Facility Status and Overview – Visualized with Cluster Diagram
RJ0900001_15
- Last Update 08/15/2025
- File Size 0.2MB
- # of Slides 2
- File Format PPTX
- Slide Ratio 16:9
- Color
Keywords
- #Content-Based Slides
- #Design-Based Slides
- #Business Introduction
- #Operational Plan
- #Diagram
- #Facilities & Equipment
- #Production and Technology Development Strategy
- #Cluster
- #Closed Cluster Diagram
- #16:9
- #cluster diagram PowerPoint
- #facility status slide template
- #3-node diagram
- #facility overview presentation
- #how to create cluster diagram in PowerPoint
About the Product
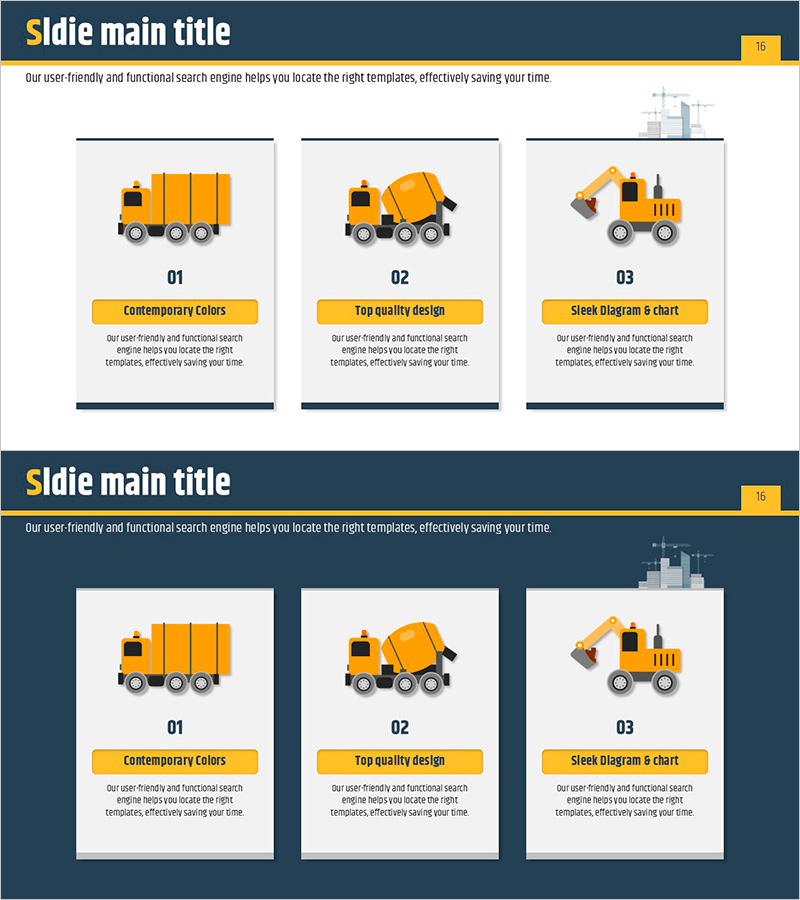
A cluster diagram PowerPoint slide that visualizes facility status and overview with a three-node structure radiating from a central hub. The design features orange icons and dark blue background for strong visual contrast, with dedicated text input areas in each node. This presentation slide is ready to use for facility management, operational planning, and business overview presentations. The cluster layout effectively communicates facility classification, function, and operational status simultaneously.
Usage Points
-
Main Usage
Presents facility status, classification, and operational structure using a centralized node layout that enables stakeholders to grasp complex facility information at a glance. Ideal for business overview and operational planning presentations.
-
How to Use
Enter the main facility name in the central node and facility classification, function, or status in the three surrounding nodes. Double-click text areas to edit content, and adjust node count or colors as needed for your specific facility structure.
-
Recommended For
Facility management departments, operations managers, and business planning teams presenting facility status reports. Suitable for manufacturing, construction, energy, and infrastructure industries. Effective for employee training sessions and investor presentations.
-
Slide Structure
Two-slide layout featuring a cluster diagram with 3 nodes: first slide on light background, second on dark blue background. Each node includes an orange icon and text input area, optimized for 16:9 widescreen format with professional spacing and alignment.
Related Products
-

Technical Competency Closed Diagram – Business Overview and Technology Status
#Business Introduction #Operational Plan #Diagram
-

Execution Plan for Wind Energy Integration – Technology Development and Production Strategy
#Product/Service Introduction #Operational Plan #Diagram
-

Detailed Guidance by Part Slide Template – Efficient Operational Planning
#Product/Service Introduction #Operational Plan #Diagram
-

How to Make Tea - Efficient Operational Strategy Diagram Slide
#Business Strategy #Operational Plan #Diagram
