Car Donut Chart – Market Share Visualization
RJ0800052_5
- Last Update 08/15/2025
- File Size 0.9MB
- # of Slides 2
- File Format PPTX
- Slide Ratio 16:9
- Color
Keywords
About the Product
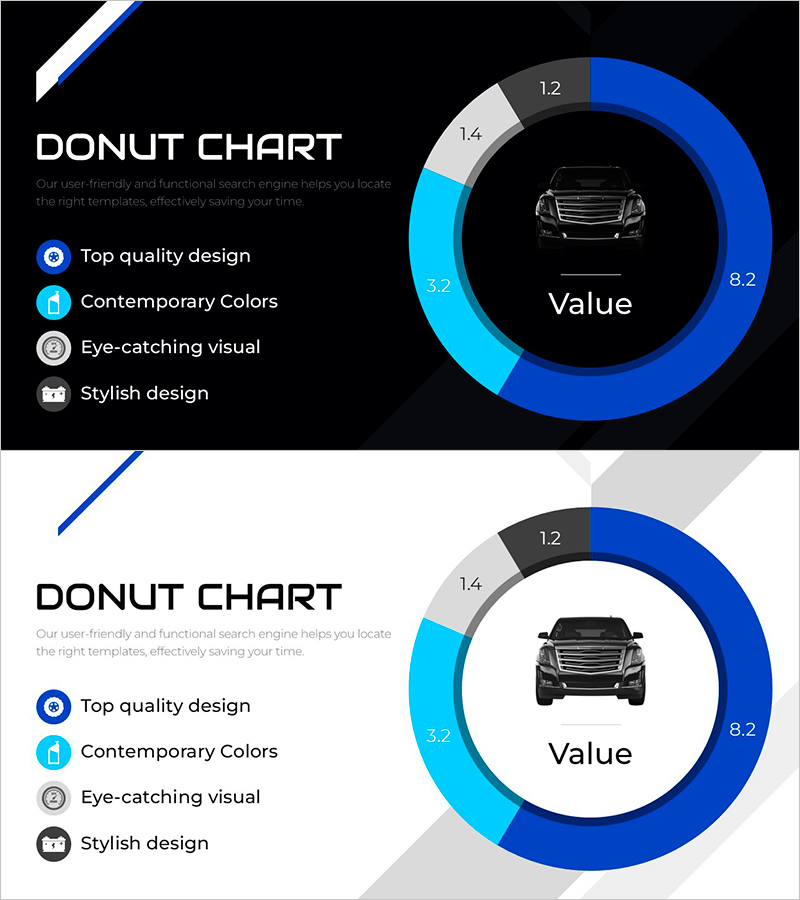
A professional donut chart PowerPoint slide designed for automotive industry market analysis. The concentric ring structure uses four distinct colors—navy blue, cyan, gray, and white—to represent proportional data with visual clarity. The center features a vehicle image and key metrics, making it ideal for visualizing market share, sales volume, customer satisfaction, and competitive positioning. This 2-slide template includes both dark and light background versions in 16:9 widescreen PPTX format, fully editable and ready for immediate use in presentations.
Usage Points
-
Main Usage
Effectively communicates proportional relationships such as market share, sales distribution, customer satisfaction ratings, and product composition. The centered vehicle image combined with numerical data emphasizes industry-specific insights and enhances audience comprehension of complex market dynamics.
-
How to Use
Ideal for automotive industry presentations, market analysis reports, sales performance reviews, product portfolio introductions, and competitive landscape discussions. Simply replace the segment values and labels with your own data to create a customized, professional-grade visualization in minutes.
-
Recommended For
Automotive manufacturers, dealerships, rental companies, transportation and logistics firms, market research analysts, sales and marketing professionals, executives preparing board reports, and industry consultants who need data-driven presentation materials for stakeholder communication.
-
Slide Structure
Concentric donut chart with 4 proportional segments (blue 8.2, cyan 3.2, gray 1.2, white 1.4). Central area displays vehicle image and 'Value' label. Left side includes 4-item description list with circular icons. Two versions provided: dark background and light background, both in 16:9 widescreen format.
Related Products
-

Logistics Donut Chart – Performance and Market Shares
#Business Strategy #Market and Competitor Analysis #Diagram
-

Travel Business Competitor Analysis and Market Share – Doughnut Chart Based
#Market and Competitor Analysis #Graph #Market Share
-

Travel Agency Market Share and Trends – Data Slide for Competitive Advantage
#Market and Competitor Analysis #Diagram #Graph
-

Travel Destination Infographic Market Share – Intuitive Data Visualization
#Market and Competitor Analysis #Graph #Market Share
