Vehicle Production Plan Diagram – Business Vision and Implementation Strategy
RJ0800052_4
- Last Update 08/15/2025
- File Size 0.7MB
- # of Slides 2
- File Format PPTX
- Slide Ratio 16:9
- Color
Keywords
- #Content-Based Slides
- #Design-Based Slides
- #Business Vision and Strategy
- #Business Strategy
- #Diagram
- #Business Goals
- #Production Plan
- #Flow
- #Cluster
- #Linear Flow
- #Closed Cluster Diagram
- #16:9
- #vehicle production plan diagram
- #timeline PowerPoint slide
- #year-by-year comparison
- #business vision diagram
- #strategy implementation chart
About the Product
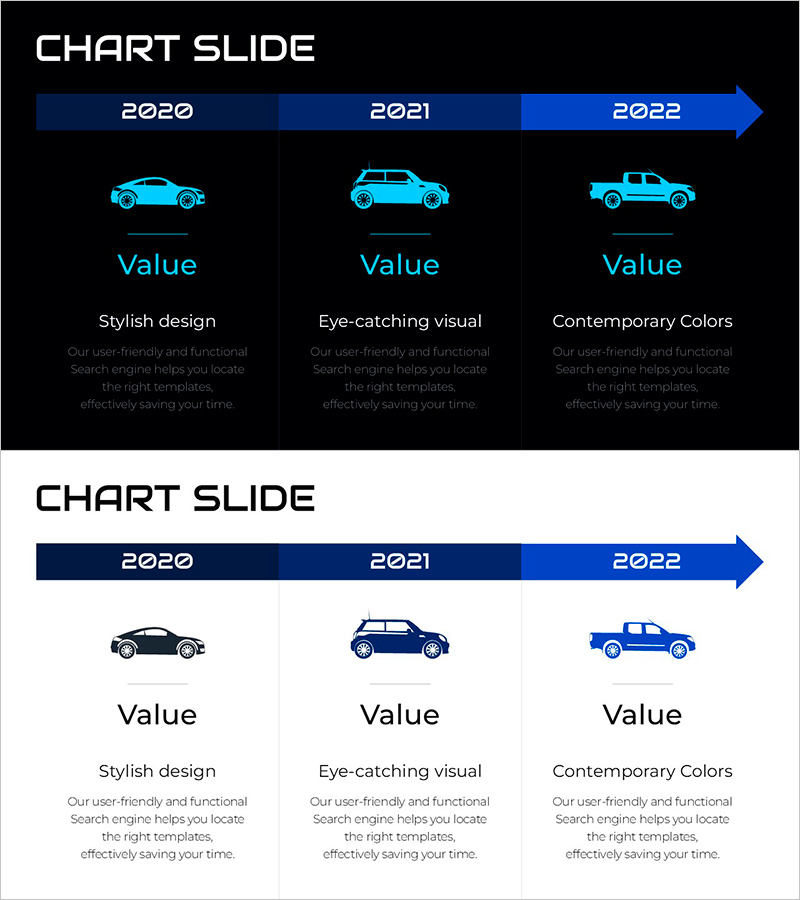
A PowerPoint slide that visualizes a three-year vehicle production plan from 2020 to 2022 with a timeline arrow and vehicle icons. The design features a dark background with year-based sections, each highlighting key value propositions through text and imagery. This presentation template effectively communicates business vision and implementation strategy across multiple years, making it ideal for corporate strategy presentations, business plan reports, and investor pitch decks. The 16:9 PPTX format allows immediate editing and customization for various business scenarios.
Usage Points
-
Main Usage
This diagram is optimized for presenting vehicle production plans and business vision across multiple years. The timeline arrow and icons clearly distinguish each stage from 2020 to 2022, enabling audiences to intuitively understand strategic evolution and progress over time.
-
How to Use
Use this slide in business strategy presentations, annual reports, investor meetings, and strategic planning sessions. Simply replace the text and icons with your own data, and adjust colors and fonts to match your corporate branding guidelines.
-
Recommended For
Automotive industry professionals, business strategy managers, executive report presenters, investor relations specialists, and marketing planners. Particularly effective when explaining multi-year plans (3+ years) in a structured, visual format.
-
Slide Structure
Two-slide layout with identical structure in different color schemes. Each slide features a horizontal timeline arrow spanning three years (2020→2021→2022), three vehicle icons, and text areas for value propositions. Available in 16:9 PPTX format for full editing capability.
Related Products
-

Diagram for Setting Banking Service Objectives
#Business Vision and Strategy #Marketing Plan and Strategy #Diagram
-

4 Approaches to Solve the Problem Slide – Effective Business Strategy
#Business Vision and Strategy #Operational Plan #Diagram
-

Introduction to Farm Business Strategy – Blue Green Slide
#Business Vision and Strategy #Business Strategy #Diagram
-

Baking with Flour Presentation Slide
#Business Vision and Strategy #Business Strategy #Diagram
