Tourist Visitor Status Table – Informative and Visual Benefits
RJ0800050_24
- Last Update 08/14/2025
- File Size 1.2MB
- # of Slides 2
- File Format PPTX
- Slide Ratio 16:9
- Color
Keywords
- #Content-Based Slides
- #Design-Based Slides
- #Product/Service Introduction
- #Financial Plans and Performance
- #Diagram
- #Development Status
- #Cash Flow Statement
- #Table
- #16:9
- #tourist visitor status table PowerPoint
- #tourism statistics slide
- #visitor comparison table PPT
- #tourism data visualization slide
- #how to create tourism report in PowerPoint
About the Product
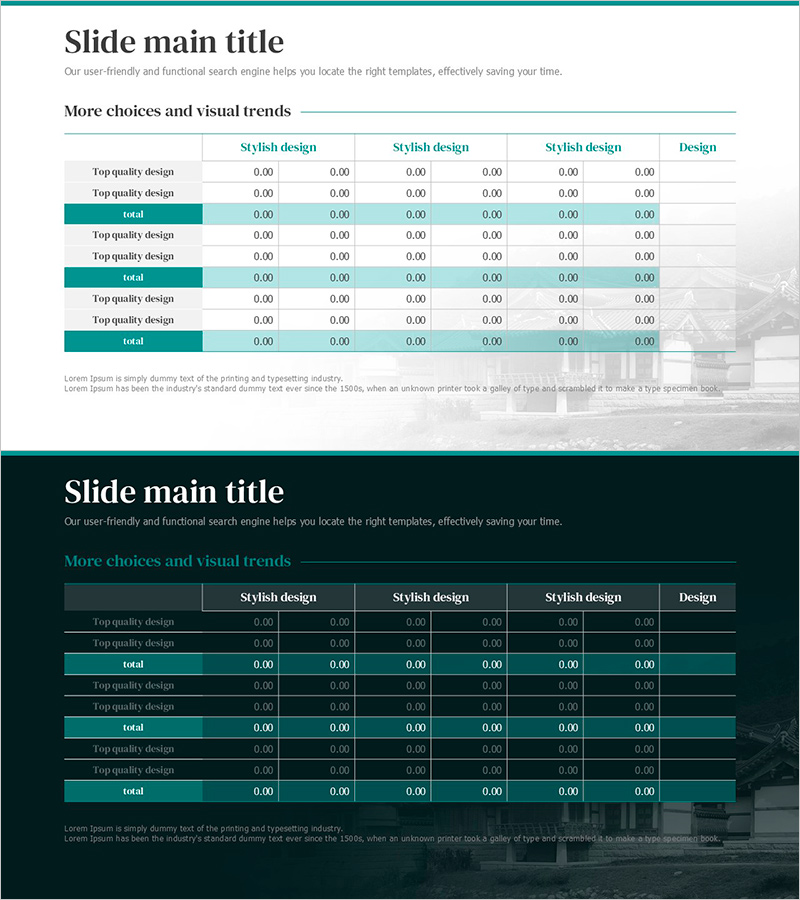
A PowerPoint slide designed to compare tourist visitor statistics at a glance. This PPT slide features a light background with teal-colored accent rows that clearly visualize visitor data, seasonal trends, regional performance, and tourism metrics. The 2-slide set offers both light and dark tone design options to match your presentation style. Text and numerical input fields are systematically arranged for immediate editing, making this PowerPoint template ideal for tourism boards, travel agencies, and regional development organizations preparing reports and presentations.
Usage Points
-
Main Usage
Presents tourist visitor statistics, seasonal and regional performance, and year-over-year trends in table format for comparison and analysis. Teal-colored accent rows highlight totals and key metrics, drawing audience attention to critical data points.
-
How to Use
Use in tourism board reports, travel agency marketing presentations, regional development initiatives, and visitor performance briefings. Simply input text and numerical data to activate the slide immediately for your presentation.
-
Recommended For
Tourism board officials, travel agency planners, regional development corporations, hotel and resort executives, tourism marketing specialists, and regional revitalization project teams presenting visitor statistics and tourism performance.
-
Slide Structure
Two-slide set with light and dark background versions. Each slide includes a title area, multiple data input rows with row labels and six numerical columns, and a teal-accent total row, allowing comparison of up to three data groups.
Related Products
-

Green & Gray Template Wide Table – Visualizing Financial Plans and Performance
#Financial Plans and Performance #Diagram #Cash Flow Statement
-

Spring Pastel Wide PowerPoint Template Tables – Design for Financial Performance
#Financial Plans and Performance #Diagram #Balance Sheet
-

Origami Presentation Template Section Table – Showcase Financial Performance
#Financial Plans and Performance #Diagram #Cash Flow Statement
-

Volume Presentation Template - Laptop Mockup and Table Chart for Modern Proposals
#Financial Plans and Performance #Diagram #Other
