Diagram Slide Visualizing Food Distribution Process
RJ0800046_12
- Last Update 08/13/2025
- File Size 17MB
- # of Slides 2
- File Format PPTX
- Slide Ratio 16:9
- Color
Keywords
- #Content-Based Slides
- #Design-Based Slides
- #Business Strategy
- #Diagram
- #Production Plan
- #Step-by-Step Schedule Plan
- #Flow
- #Cluster
- #Linear Flow
- #Closed Cluster Diagram
- #16:9
- #circular diagram PowerPoint
- #cluster diagram slide template
- #4-step process visualization
- #food distribution diagram
- #business strategy PowerPoint slide
About the Product
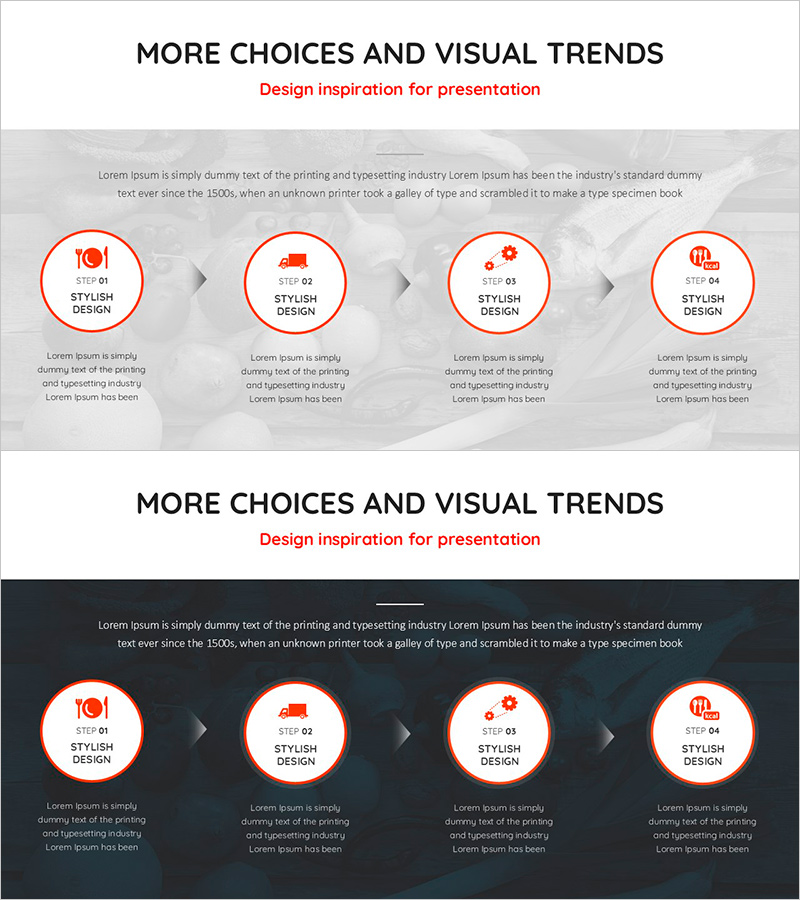
A cluster diagram PowerPoint slide visualizing a food distribution process through four circular nodes connected by directional arrows. Each step features an icon (utensil, vehicle, factory, building) highlighted with an orange circular border, creating an intuitive process flow representation. Delivered in 16:9 widescreen format with 2 slides, this presentation template is ready for immediate use in business strategy presentations, supply chain management discussions, and phased timeline explanations. The arrow connections clarify relationships between stages, while text areas below each node allow detailed descriptions to be added for comprehensive documentation.
Usage Points
-
Main Usage
Clearly represents supply chain stages, business process flows, and circular structures across four interconnected nodes. Enables stakeholders to understand each phase's role and interdependencies at a glance, making it ideal for executive briefings, investor presentations, and internal training sessions in food, logistics, and manufacturing sectors.
-
How to Use
Replace icons within circular nodes with industry-specific images and populate text areas with stage names, responsible departments, and timelines. Customize arrow directions to emphasize process flow, and adjust background and icon colors to match corporate brand guidelines for consistent visual identity.
-
Recommended For
Ideal for food and beverage, logistics, manufacturing, and distribution companies preparing business plans, supply chain management reports, and process improvement proposals. Also suitable for consulting firms and business schools delivering client presentations and management education materials.
-
Slide Structure
Two-slide set. First slide features a light gray background with four circular nodes (utensil, vehicle, factory, building icons) outlined in orange and connected by directional arrows. Second slide provides a dark background version with identical structure. Text input areas positioned below each node for detailed annotations.
Related Products
-

Design Slide Ideal for Storage Product Introduction – Innovation and Efficiency
#Business Strategy #Diagram #Production Plan
-

Medical Business Linear Diagram – Visualizing Business Strategy
#Business Strategy #Diagram #Production Plan
-

Business Progress Steps Slide – Clear Progress Flow
#Business Strategy #Diagram #Step-by-Step Schedule Plan
-

Construction Stage Diagram – Visualizing Business Strategies
#Business Strategy #Diagram #Production Plan
