Depression Diagnosis Analysis Graph – Market and Competitor Analysis
RL0100087_4
- Last Update 01/23/2025
- File Size 4.8MB
- # of Slides 2
- File Format PPTX
- Slide Ratio 4:3
- Color
Keywords
- #Content-Based Slides
- #Design-Based Slides
- #Market and Competitor Analysis
- #Graph
- #Competitor Analysis
- #Market Analysis
- #Column
- #Grouped Column
- #4:3
- #grouped bar chart PowerPoint
- #bar graph slide template
- #data comparison chart PPT
- #market analysis graph template
- #competitor analysis PowerPoint slide
About the Product
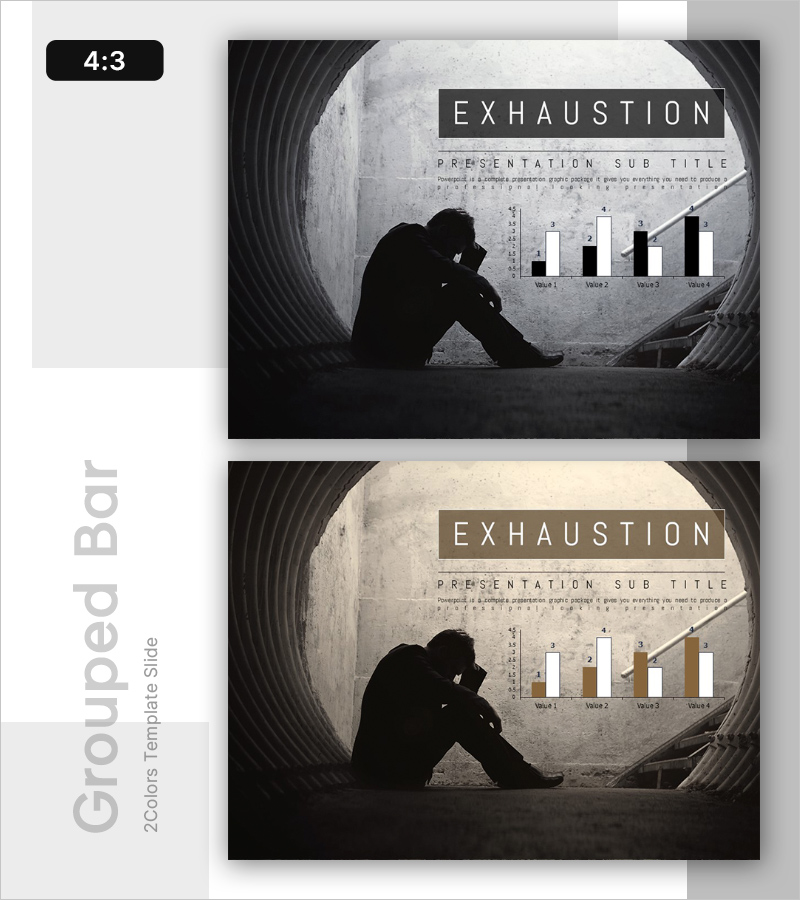
A grouped bar chart PowerPoint slide set designed for depression diagnosis analysis and market comparison presentations. This 2-slide template features black and brown dual-tone styling, ideal for visualizing market analysis, competitor benchmarking, and diagnostic data comparisons. Each slide displays 4 items across 2 data series in grouped bar format, perfect for medical reports, market research presentations, and competitive analysis documents. Provided in 4:3 ratio PPTX format, ready to populate with your data and present immediately.
Usage Points
-
Main Usage
Displays two data series across four items in grouped bar format, enabling side-by-side comparison. Ideal for contrasting market size vs. competitor size, diagnostic metrics vs. standard values, quarterly performance vs. targets, or any dual-variable analysis.
-
How to Use
Insert into medical reports' diagnostic analysis sections, business plan market analysis pages, competitive analysis documents, or quarterly performance presentations. Simply input your data and the chart updates automatically with your values.
-
Recommended For
Healthcare professionals, marketing managers, executives, consultants, and researchers who need to visualize data-driven analysis results. Particularly suited for situations requiring two-variable comparative analysis and professional presentation contexts.
-
Slide Structure
Slide 1: Black background with white grouped bars (4 items × 2 series). Slide 2: Beige background with white and brown grouped bars (4 items × 2 series). Both slides include title area, legend, Y-axis scale, and X-axis item labels for complete data presentation.
Related Products
-

Earth Analysis Bundle Vertical Bar Graph – Market and Competitor Analysis
#Market and Competitor Analysis #Graph #Competitor Analysis
-

Competitor Capability Analysis Chart – Efficient Market Analysis
#Market and Competitor Analysis #Graph #Competitor Analysis
-

Gradient Vertical Bar Graph for Market Analysis – Innovation and Growth
#Market and Competitor Analysis #Graph #Competitor Analysis
-

Line Graph and Clustered Column Graph – Essential for Competitor Analysis
#Market and Competitor Analysis #Graph #Competitor Analysis
