Pet Market Status Graph – Visualizing Financial Performance in PowerPoint
RJ0800040_18
- Last Update 08/11/2025
- File Size 0.3MB
- # of Slides 2
- File Format PPTX
- Slide Ratio 16:9
- Color
Keywords
About the Product
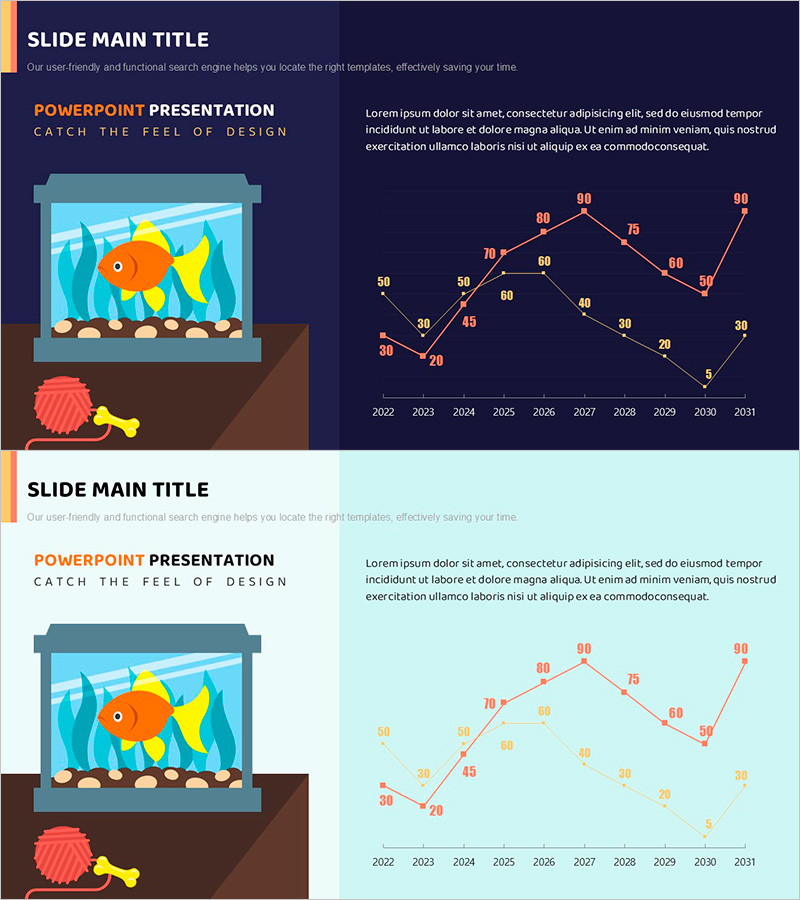
A multi-series line chart PowerPoint slide visualizing pet market trends from 2022 to 2031. This presentation slide features two data series displayed in orange and yellow tones, enabling simultaneous comparison of sales performance and market growth over a decade. The dark navy background with bright accent colors ensures excellent readability for financial reports, market analysis, and sales presentations. The 16:9 widescreen format includes two slide variations for flexible integration into your PowerPoint deck.
Usage Points
-
Main Usage
Visualizes time-series data such as annual revenue trends, market growth rates, and sales performance over multiple years. The dual-series design allows stakeholders to compare two related metrics simultaneously and identify patterns and fluctuations at a glance.
-
How to Use
Insert this slide into financial reports, quarterly business reviews, market analysis presentations, and investor pitch decks. Two versions are provided—one with dark background and one with light background—allowing you to match your presentation's overall design theme.
-
Recommended For
Finance teams, marketing departments, business executives, market analysts, and sales professionals presenting performance metrics. Ideal for presentations requiring long-term trend analysis, year-over-year comparisons, and data-driven business insights.
-
Slide Structure
Features a coordinate system with X-axis spanning 2022–2031 (10 years) and Y-axis ranging from 0 to 90. Two line series in orange and yellow intersect and diverge throughout the timeline, with numerical labels at each data point for precise value reference and professional appearance.
Related Products
-

Changes in Pet Plant References – Financial Performance Analysis
#Business Strategy #Financial Plans and Performance #Graph
-

Cost Increase Rate Analysis Chart
#Financial Plans and Performance #Diagram #Graph
-

Market Trends with Key Focus Areas
#Market and Competitor Analysis #Financial Plans and Performance #Graph
-

Product-wise Vertical Bar Chart and Analysis - Market and Competitive Analysis
#Market and Competitor Analysis #Financial Plans and Performance #Graph
