Slide Template for Sports Data Analysis – Understanding Market Trends and Information
RJ0800036_11
- Last Update 08/10/2025
- File Size 5.8MB
- # of Slides 2
- File Format PPTX
- Slide Ratio 16:9
- Color
Keywords
- #Content-Based Slides
- #Design-Based Slides
- #Market and Competitor Analysis
- #Financial Plans and Performance
- #Diagram
- #Customer Analysis
- #Cash Flow Statement
- #Table
- #Standard Table
- #16:9
- #sports data analysis PowerPoint
- #table slide template
- #market analysis comparison chart
- #financial data presentation slide
- #sports industry analysis deck
- #how to create data table in PowerPoint
About the Product
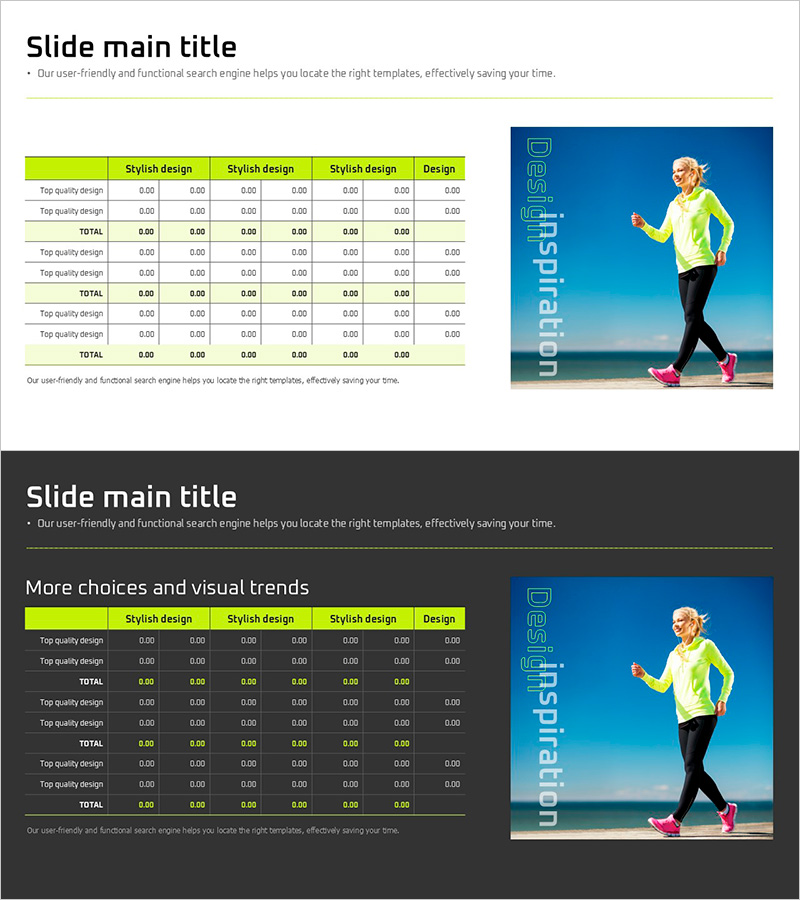
A 2-slide PowerPoint presentation designed to organize market trends and financial information for the sports industry. The primary design features a 7-column horizontal table with a lime header and navy accent colors, enabling clear data comparison and analysis. Each row accommodates product quality design items and numerical data entry, making it immediately applicable for customer analysis, market analysis, and financial planning presentations. Available in 16:9 widescreen PPTX format, fully editable across all PowerPoint versions.
Usage Points
-
Main Usage
Visualize sports industry market trends, customer analysis, and financial planning data in a structured table format to deliver clear information to presentation audiences. Highly effective for simultaneous comparison and analysis of multiple data points.
-
How to Use
Enter analysis category names (e.g., Stylish Design, Design) in the lime header row, then input corresponding numerical data in rows below. Use the TOTAL row to display aggregate figures for at-a-glance overview. Colors and fonts are fully customizable to match your brand guidelines.
-
Recommended For
Recommended for sports marketing team market analysis presentations, finance department budget comparison reports, executive quarterly performance analysis decks, and sports industry consultant client analysis materials.
-
Slide Structure
2-slide layout. Slide 1: Lime header (7 columns) + 3 data entry rows + TOTAL row. Slide 2: Navy background + identical table structure + right-side image area (sports athlete photo). All cells support text and numerical editing.
Related Products
-

Table Charts for Exercise – Market Analysis and Performance
#Market and Competitor Analysis #Financial Plans and Performance #Diagram
-

Square Frame Presentation Template for Financial Performance – Efficiency and Clarity
#Financial Plans and Performance #Diagram #Cash Flow Statement
-

Square Frame Infographic Elements Slide – Perfect Combination of Business Vision and Financial Planning
#Business Vision and Strategy #Financial Plans and Performance #Diagram
-

Business Plan PowerPoint Design – Excel Table Utilization
#Financial Plans and Performance #Diagram #Balance Sheet
