Logistics Material Status Table – Financial Planning and Performance
RJ0800029_15
- Last Update 08/07/2025
- File Size 0.3MB
- # of Slides 2
- File Format PPTX
- Slide Ratio 16:9
- Color
Keywords
- #Content-Based Slides
- #Design-Based Slides
- #Financial Plans and Performance
- #Diagram
- #Balance Sheet
- #Cash Flow Statement
- #Table
- #16:9
- #logistics material status table PowerPoint
- #financial data table slide design
- #how to create a status table in PowerPoint
- #logistics report PPT template
- #financial metrics comparison slide
About the Product
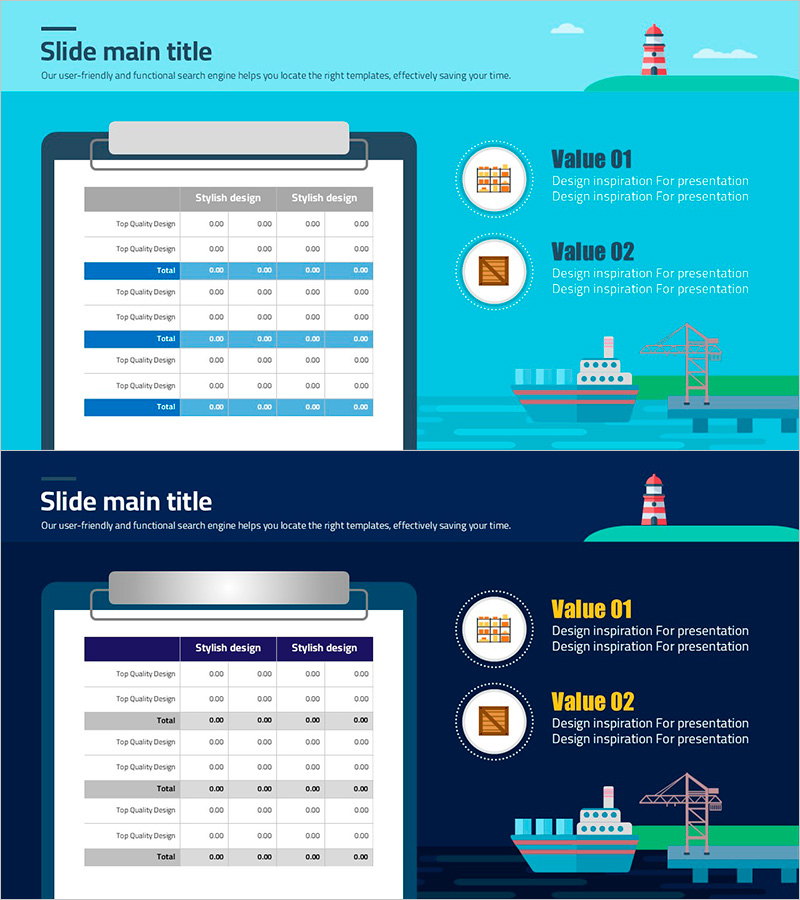
A PowerPoint slide that visualizes logistics and material status alongside financial metrics. The design features a light turquoise background with a desktop monitor-style table layout that clearly separates data entry areas. The three-section table structure accommodates quality indicators, financial figures, and performance metrics, with blue highlight rows marking totals. A dark navy version is also included for flexibility in presentation contexts. Provided in editable PPTX format, this slide is ideal for logistics status reports, financial planning presentations, and performance analysis materials.
Usage Points
-
Main Usage
This slide is designed for reporting both material logistics status and financial performance simultaneously. The structured table format enables decision-makers to quickly grasp current conditions, with blue-highlighted total rows emphasizing key figures.
-
How to Use
Enter logistics material items, quantities, amounts, and performance rates into each section's text fields. Table rows and columns can be added or removed as needed, and colors and fonts can be adjusted to match corporate branding. Use for logistics status reports, financial planning presentations, and quarterly performance analysis.
-
Recommended For
Recommended for logistics and supply chain management teams, finance and accounting departments, business report writers, and performance analysis specialists. Particularly effective for logistics cost analysis, material inventory status reporting, and financial performance comparison presentations.
-
Slide Structure
The slide set contains 2 slides, each with 3 independent table sections. Each table includes a quality indicator row, 2 data entry rows, and a total row, with blue highlight rows visually distinguishing totals. Two color options are provided: light turquoise and dark navy versions for different presentation contexts.
Related Products
-

Volume Presentation Template - Laptop Mockup and Table Chart for Modern Proposals
#Financial Plans and Performance #Diagram #Other
-

Slide Visualizing Financial Plans with Diagonal Box and Table
#Financial Plans and Performance #Diagram #Balance Sheet
-

Data Analysis Table – Visualization of Financial Planning and Performance
#Financial Plans and Performance #Diagram #Balance Sheet
-

Spring Pastel Wide PowerPoint Template Tables – Design for Financial Performance
#Financial Plans and Performance #Diagram #Balance Sheet
