Trend of Cargo Volume by Transportation Means – Market Trends Analysis
RJ0800029_11
- Last Update 08/07/2025
- File Size 0.3MB
- # of Slides 2
- File Format PPTX
- Slide Ratio 16:9
- Color
Keywords
- #Content-Based Slides
- #Design-Based Slides
- #Market and Competitor Analysis
- #Financial Plans and Performance
- #Diagram
- #Graph
- #Industry Trends
- #Key Financial Indicators
- #Table
- #Column
- #Horizontal Table
- #Segmented Column
- #16:9
- #stacked bar chart PowerPoint
- #transportation comparison slide
- #cargo volume trends template
- #market analysis chart
- #4-series bar graph download
About the Product
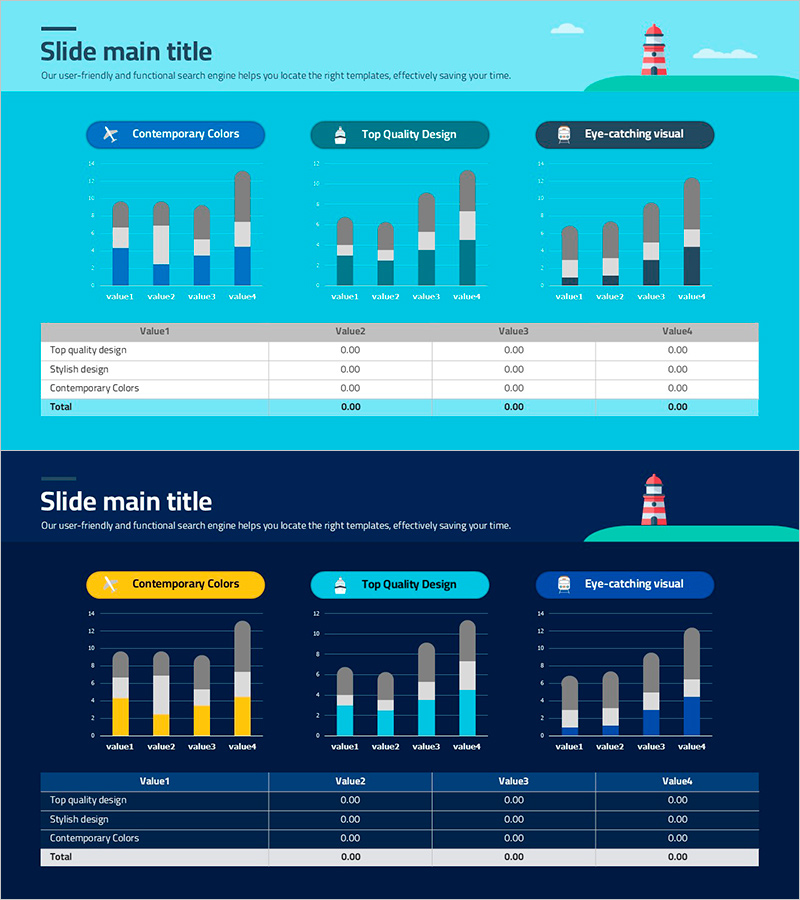
A stacked bar chart PowerPoint slide visualizing cargo volume trends by transportation means across four data series. This presentation template is optimized for market trend analysis and business performance reporting. The design features a light blue background with white, gray, and dark blue bar segments, enabling clear comparison of each transportation mode's contribution. A data table below the charts provides precise numerical values to enhance credibility. Ideal for financial reports, business analysis presentations, marketing strategy decks, and logistics industry briefings where data-driven insights are essential.
Usage Points
-
Main Usage
Displays cargo volume data across four transportation categories, simultaneously showing temporal trends and comparative performance between modes. Serves as a quantitative foundation for market trend analysis, business performance reporting, competitive benchmarking, and strategic decision-making in logistics and transportation sectors.
-
How to Use
Input cargo volume data for each transportation mode (value1–4) and the bar segments automatically adjust proportionally. Select from three color theme tabs (Contemporary Colors, Top Quality Design, Eye-catching visual) to match your presentation context. Complete the data table below with exact figures to reinforce audience confidence in your analysis.
-
Recommended For
Logistics and transportation executives presenting quarterly performance reviews, market research analysts conducting industry trend analysis, finance teams reporting divisional results, consulting firms delivering industry benchmarking studies, and academic researchers presenting transportation policy research.
-
Slide Structure
Two-slide set: Slide 1 features a light blue background with bright color tones; Slide 2 uses a dark navy background for contrast. Each slide contains three stacked bar chart sets with four data series and a data table (4 columns × 4 rows) below. Delivered in 16:9 widescreen format, fully editable PPTX compatible with all PowerPoint versions.
Related Products
-

Trend of Market Share by Suit Product – Effective Graph for Market Analysis
#Market and Competitor Analysis #Graph #Market Analysis
-

Year-by-Year Breakdown Comparison Analysis Graph
#Market and Competitor Analysis #Graph #Future Outlook
-

Column Segmentation Graph for Research – Visualization of Market Trends
#Market and Competitor Analysis #Marketing Plan and Strategy #Graph
-

Market Trends and Analysis Green Navy – Clearly Displaying Market Trends
#Market and Competitor Analysis #Graph #Market Analysis
