Average Internet Usage Time Visualization Slide – Market Insights
RJ0800026_11
- Last Update 08/06/2025
- File Size 0.4MB
- # of Slides 2
- File Format PPTX
- Slide Ratio 16:9
- Color
Keywords
About the Product
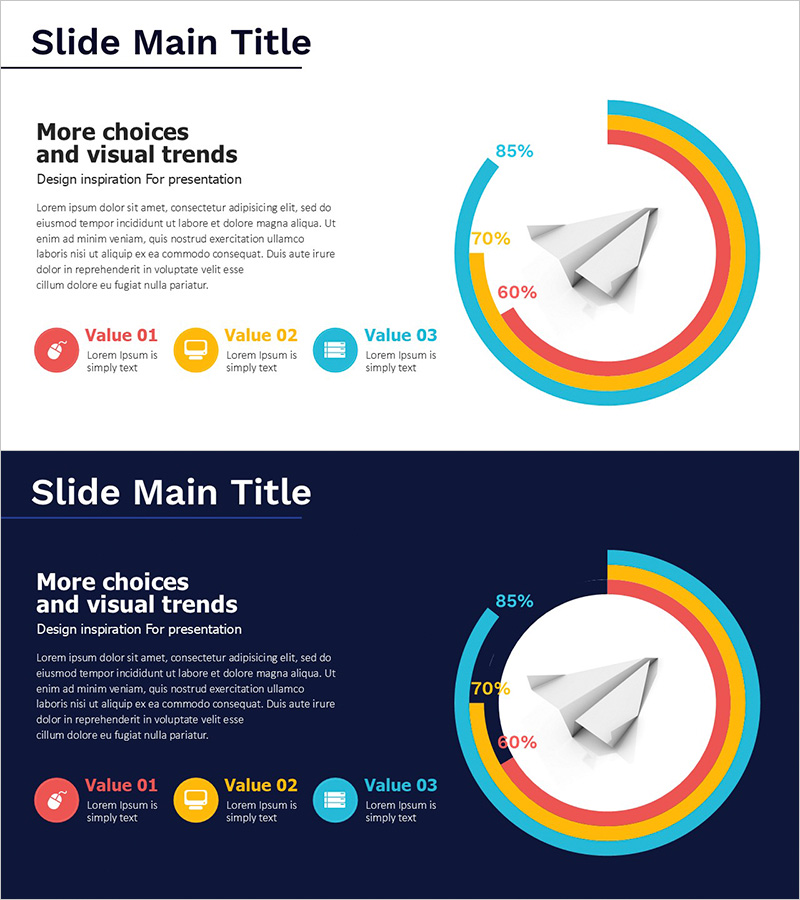
A multi-layer donut chart PowerPoint slide that displays three data categories simultaneously using concentric rings in blue, red, and yellow. The chart visualizes percentages (85%, 70%, 60%) for internet usage time, market share, competitive advantage, or customer satisfaction metrics. The left side features a text block for title, subtitle, and description, while the right side includes three circular icon buttons to highlight Value 01, 02, and 03. Delivered in 16:9 widescreen format with 2 slides, this presentation template is ready to use for market analysis reports, survey result presentations, and competitive positioning decks.
Usage Points
-
Main Usage
Visualize and compare multiple data categories as percentages or proportions in a single view. Ideal for presenting market share distribution, customer satisfaction ratings, internet usage patterns, or any three-way comparative analysis requiring simultaneous ratio display.
-
How to Use
Edit the left text block with your presentation title, subtitle, and supporting description. Replace the sample percentages (85%, 70%, 60%) with your actual data values. Update the three circular icon button labels from Value 01, 02, 03 to your specific category names, then use the slide in your presentation.
-
Recommended For
Marketing professionals presenting market analysis and competitive positioning, research teams sharing survey findings, sales teams reporting customer satisfaction metrics, and executives delivering quarterly performance reviews with multi-category comparisons.
-
Slide Structure
2-slide set. Slide 1: White background with three concentric donut rings (blue outer, red middle, yellow inner), 3D arrow icon in center, left text block, three circular icon buttons at bottom. Slide 2: Dark navy background with identical donut chart layout for dark theme option. Both slides maintain consistent data visualization structure with editable text and percentage fields.
Related Products
-

Component Development Scale Pie Chart – Visualization of Competitive Advantage
#Product/Service Introduction #Market and Competitor Analysis #Graph
-

Competitive Advantage Donut Pie Chart (3 colors) – Frontline of Market Analysis
#Market and Competitor Analysis #Graph #Competitor Analysis
-

Analysis of Climbing Success Rate with Doughnut Chart
#Business Strategy #Market and Competitor Analysis #Graph
-

Market Analysis and Competitive Advantage Graph – The Power of Data Visualization
#Market and Competitor Analysis #Graph #Market Analysis
