A Change in One's Daily Life After Exercising – Visualizing Lifestyle Changes
RJ0800025_18
- Last Update 08/06/2025
- File Size 1MB
- # of Slides 2
- File Format PPTX
- Slide Ratio 16:9
- Color
Keywords
About the Product
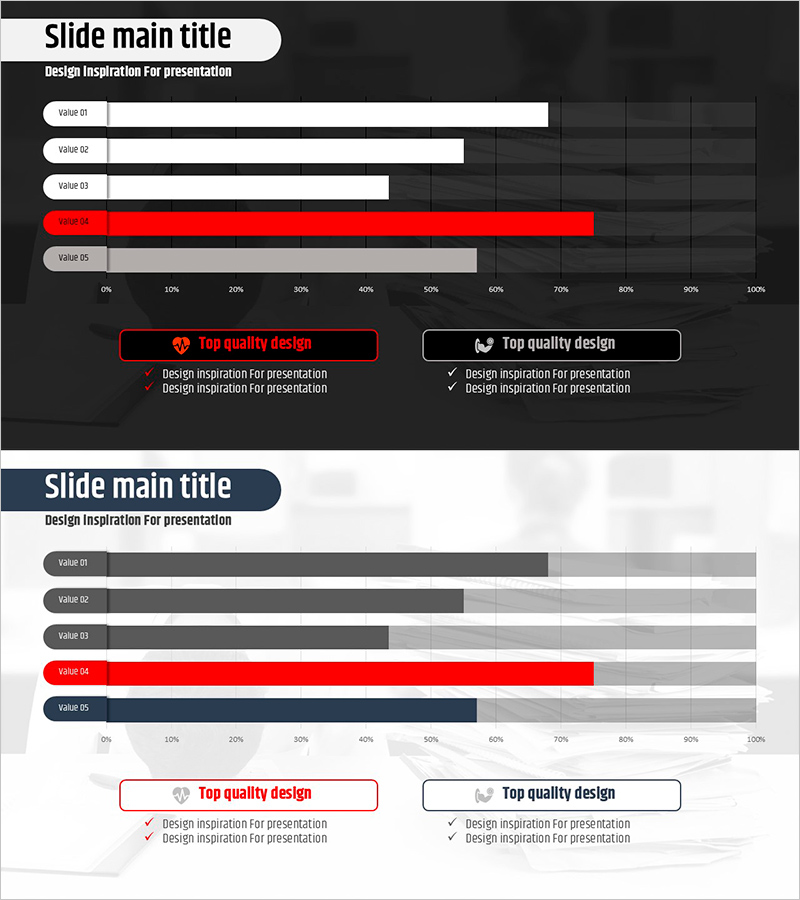
A horizontal bar chart PowerPoint slide visualizing lifestyle changes after exercise with five comparable data points. The design features a dark background with white labels and color-coded bars in red, gray, and blue for clear numerical comparison. Provided as a 2-slide set with identical layouts, optimized for 16:9 widescreen format. Ready to use for health improvement presentations, lifestyle change reports, and data-driven business communications.
Usage Points
-
Main Usage
Clearly compare and communicate lifestyle changes, health improvement metrics, and performance data through numerical visualization. The horizontal bar layout enables intuitive comparison of values across categories, while color coding strengthens category differentiation and visual hierarchy.
-
How to Use
Enter your data into the five labeled fields (Value 01–05) and adjust bar lengths proportionally. The white text on dark background ensures excellent readability in projector presentations. Ideal for fitness, wellness, and lifestyle improvement topic presentations. Bars scale from 0–100% for easy percentage-based data input.
-
Recommended For
Fitness instructors, health professionals, wellness consultants, data analysts, and marketing managers presenting performance comparisons and change metrics. Suitable for corporate internal reports, client-facing presentations, health seminars, and educational training materials.
-
Slide Structure
2-slide set with identical layouts for consistency. Each slide contains a title area at the top, five labeled items with circular badges on the left, horizontal bars scaled 0–100% in red, gray, and blue, and a legend section at the bottom. Optimized for 16:9 widescreen presentation format.
Related Products
-

Donut Chart for Components and Market Share Visualization – Market Analysis
#Market and Competitor Analysis #Graph #Market Status
-

Food Ingredient Horizontal Subdivision Graph – Market Trend Analysis
#Market and Competitor Analysis #Graph #Industry Trends
-

Analysis of Smart Network Systems – Data Visualization for Innovation
#Product/Service Introduction #Diagram #Graph
-

Proportional Graph by Meat Part – Market Analysis Insights
#Market and Competitor Analysis #Diagram #Graph
