Current Status of Smartphone Addiction of Modern People by Country – Minimal Design Diagram
RJ0800025_13
- Last Update 08/06/2025
- File Size 0.6MB
- # of Slides 2
- File Format PPTX
- Slide Ratio 16:9
- Color
Keywords
- #Content-Based Slides
- #Design-Based Slides
- #Market and Competitor Analysis
- #Diagram
- #Other
- #Market Analysis
- #Table
- #Map
- #16:9
- #smartphone addiction map PowerPoint slide
- #country comparison analysis presentation
- #global data visualization slides
- #market analysis map template
- #diagram table combined PPT
About the Product
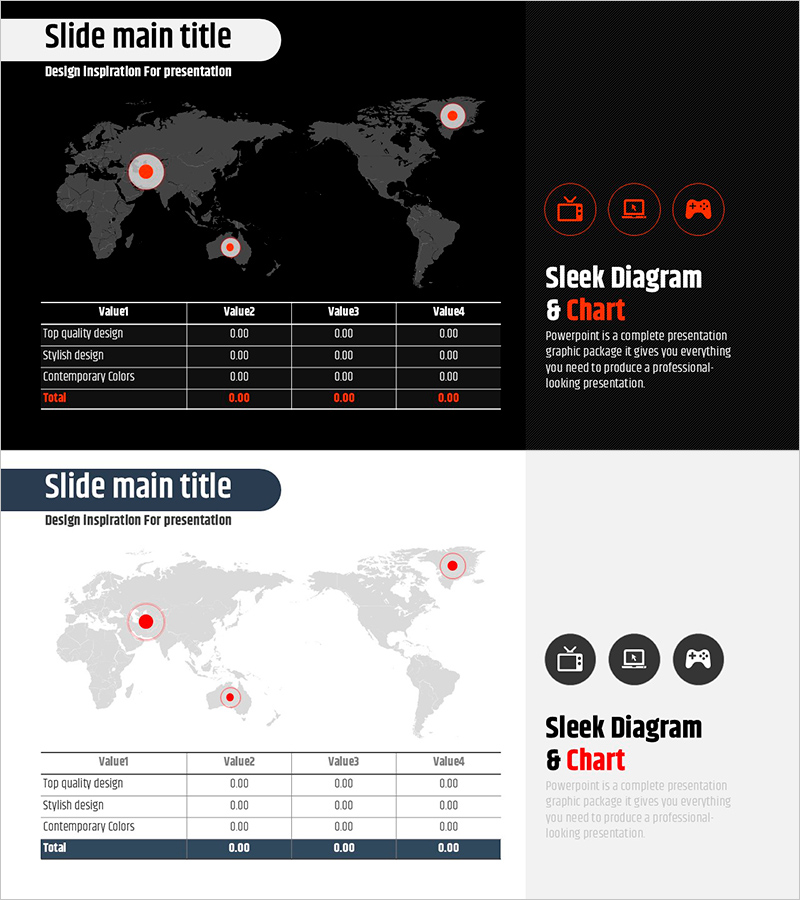
A PowerPoint slide that visually compares smartphone addiction rates across countries using a world map and data table. Key nations are highlighted on the map with color-coded markers, while a structured table below presents quantitative metrics across four columns. The design combines a dark background with white typography and orange accent colors in a minimal layout, enhancing presentation credibility. Two slide variations with different backgrounds (black and light gray) allow seamless integration into existing presentations. Ideal for market analysis, social trend reports, policy proposals, and data-driven business presentations.
Usage Points
-
Main Usage
Enables global market analysis, social phenomenon research, and policy recommendations by presenting country-level data in a single visual. The map-based visualization conveys regional differences intuitively while the table provides quantitative evidence to support analysis and decision-making.
-
How to Use
Edit the map markers and table values to reflect your specific data and analysis findings. Choose the dark background slide for formal, premium-tone presentations or the light background for approachable, friendly-tone presentations. All text and data fields are fully editable.
-
Recommended For
Marketing research teams, policy analysts, academic presenters, business consultants, and data-driven professionals. Best suited for market overview sections, competitive analysis, global trend reports, and strategic planning presentations.
-
Slide Structure
Two-slide set, each featuring a world map with three highlighted country markers, three icon symbols in the upper right, and a four-column data table at the bottom. Includes one title text field and 16 editable table cells (4 rows × 4 columns) supporting comparative information structure.
Related Products
-

Pixel Graphical Maps and Tables - Visualizing Global Network
#Company Introduction #Market and Competitor Analysis #Diagram
-

World Map Data Slide | Regional Statistics Visualization PPT
#Market and Competitor Analysis #Marketing Plan and Strategy #Other
-

Business Plan Presentation Template - Asia Map
#Market and Competitor Analysis #Diagram #Other
-

Sensuous Cloud Presentation Template with World Map
#Market and Competitor Analysis #Diagram #Other
