Slide Visualizing Environmental Protection Expenditure
RJ0600067_18
- Last Update 07/07/2025
- File Size 0.5MB
- # of Slides 2
- File Format PPTX
- Slide Ratio 16:9
- Color
Keywords
About the Product
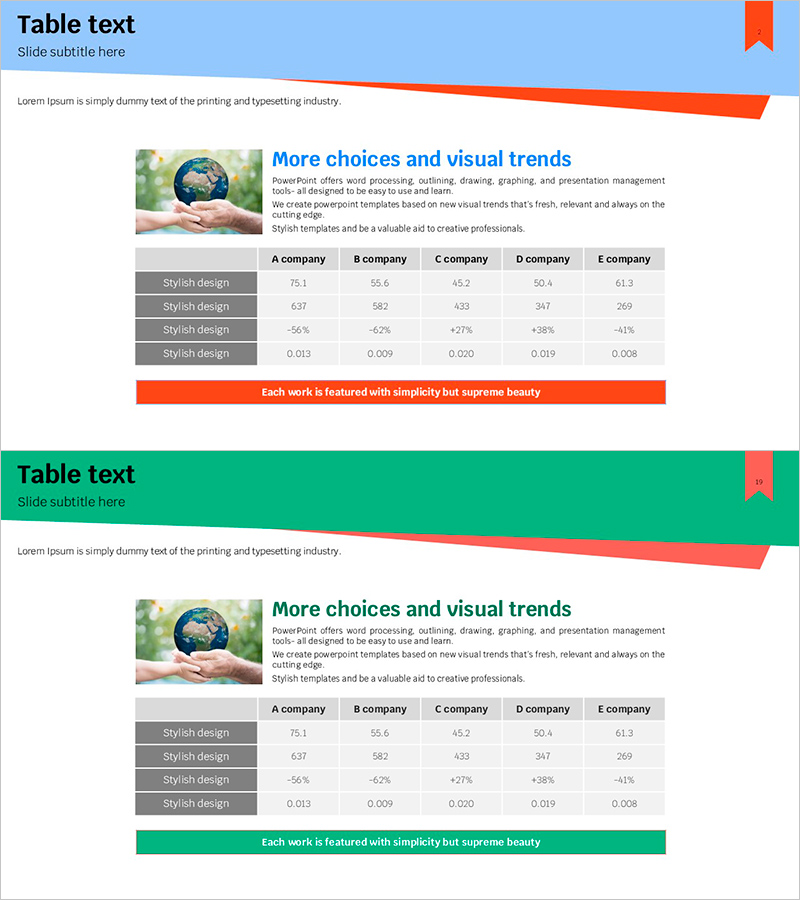
A professional PowerPoint slide designed for comparing financial metrics across multiple companies and departments. The template features a 5-column table structure with rows for key financial indicators such as revenue, growth rate, and financial ratios. Blue and orange accent elements highlight critical data points, while the upper section includes space for company logos or relevant imagery alongside descriptive text. This slide is ideal for investor presentations, executive reports, financial analysis documents, and competitive benchmarking. The layout supports both numerical data and percentage comparisons, making it versatile for various financial presentation scenarios.
Usage Points
-
Main Usage
Visualize and compare quantitative financial metrics—such as revenue, growth rates, and financial ratios—across multiple companies or departments in a clear tabular format. This slide supports data-driven decision-making in investor relations, executive briefings, financial analysis presentations, and competitive benchmarking reports.
-
How to Use
Insert company logos or relevant images in the upper section, add your title and descriptive text, then populate the table cells with actual financial figures. Customize row headers (revenue, growth rate, etc.) and column headers (company names) to match your specific analysis requirements. Colors and fonts can be easily modified to align with your corporate branding.
-
Recommended For
CFOs, financial analysts, investor relations professionals, executive management teams, investment pitch presentations, shareholder meetings, consulting firms conducting financial analysis, and financial institutions preparing credit assessment reports.
-
Slide Structure
Two-slide template: Slide 1 features a blue header background with title, subtitle, and descriptive text area, left-side image space, and a 5-column × 4-row table on the right. Slide 2 uses a green header background with identical layout for additional financial comparisons. All cells support text and numerical input with customizable colors and formatting.
Related Products
-

Travel Budget and Expense Planning Slide
#Financial Plans and Performance #Diagram #Capital Requirements
-

Sea Lighthouse Sales and Profit Table – Effective Analysis in Blue Green
#Financial Plans and Performance #Diagram #Capital Requirements
-

Table Chart and Arrow Signs
#Financial Plans and Performance #Diagram #Capital Requirements
-

Estimated Budget Breakdown – Financial Planning and Budget Management
#Financial Plans and Performance #Diagram #Capital Requirements
