Diagonal Background and Donut Chart Analysis – Quality and Style
RJ0800022_6
- Last Update 08/05/2025
- File Size 0.5MB
- # of Slides 2
- File Format PPTX
- Slide Ratio 16:9
- Color
Keywords
About the Product
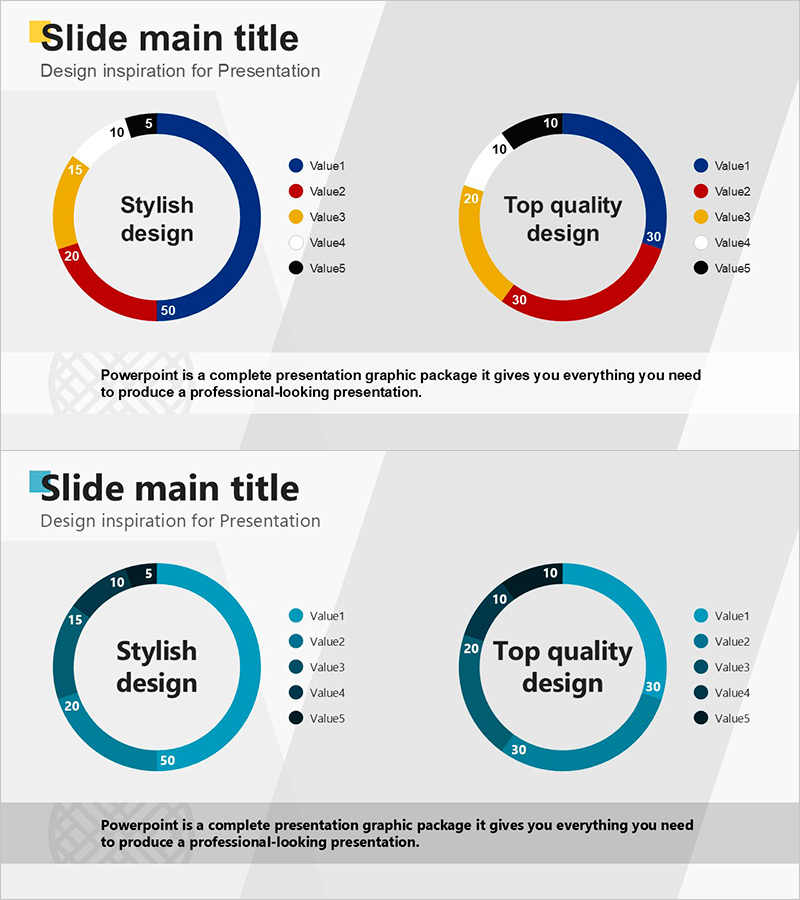
A 2-slide PowerPoint presentation featuring donut charts with diagonal geometric backgrounds for data visualization. Each slide displays a 5-segment donut chart with numerical labels and legend, representing market share, composition ratios, or distribution percentages. The left slide showcases a 'Stylish Design' version with blue, red, and yellow color scheme, while the right presents a 'Top Quality Design' with blue, red, yellow, and black accents. Delivered in 16:9 widescreen PPTX format, fully editable for business presentations, marketing analysis, financial reports, and executive dashboards.
Usage Points
-
Main Usage
Visualize five-category data such as market share percentages, sales composition, customer distribution, budget allocation, or revenue breakdown using donut chart format. The hollow center allows for inserting key metrics, totals, or central messaging to enhance data emphasis.
-
How to Use
Use the left slide for stylish, contemporary presentations and the right slide for premium, formal business reports. Double-click chart segments to edit values and labels, and adjust colors to match corporate branding guidelines. Replace placeholder data with actual figures.
-
Recommended For
Marketing teams presenting market analysis, finance departments reporting budget status, sales teams analyzing revenue composition, executive leadership for quarterly performance reviews, management consulting proposals requiring data visualization, and investor presentations.
-
Slide Structure
Two-slide set with diagonal geometric backgrounds. Each slide contains two 5-segment donut charts positioned side-by-side. Charts include internal text labels ('Stylish Design' / 'Top Quality Design'), external legend entries (Value1–Value5), and numerical data points. Color schemes differentiate between design variations.
Related Products
-

Construction Progress Chart – Business Introduction and Market Analysis
#Business Introduction #Market and Competitor Analysis #Graph
-

Donation Participation Rate Graph – Business Strategy and Future Outlook
#Business Strategy #Market and Competitor Analysis #Graph
-

Architectural Illustration Templates and Line Charts – Visualizing Market and Competitive Advantage
#Market and Competitor Analysis #Graph #Market Analysis
-

Analysis of Major Sales Segments – Visualizing Performance with Bar Chart Template
#Business Strategy #Graph #Achievements
