Orange Green Highlight Bar Chart – Market Analysis and Marketing Strategy
RJ0500007_13
- Last Update 06/09/2025
- File Size 1.2MB
- # of Slides 2
- File Format PPTX
- Slide Ratio 16:9
- Color
Keywords
- #Content-Based Slides
- #Design-Based Slides
- #Market and Competitor Analysis
- #Marketing Plan and Strategy
- #Graph
- #Market Status
- #Marketing Objectives
- #Horizontal Bar
- #Segmented Horizontal Bar
- #16:9
- #horizontal bar chart PowerPoint
- #comparative bar graph template
- #market analysis slide
- #marketing data visualization
- #arrow highlight chart
About the Product
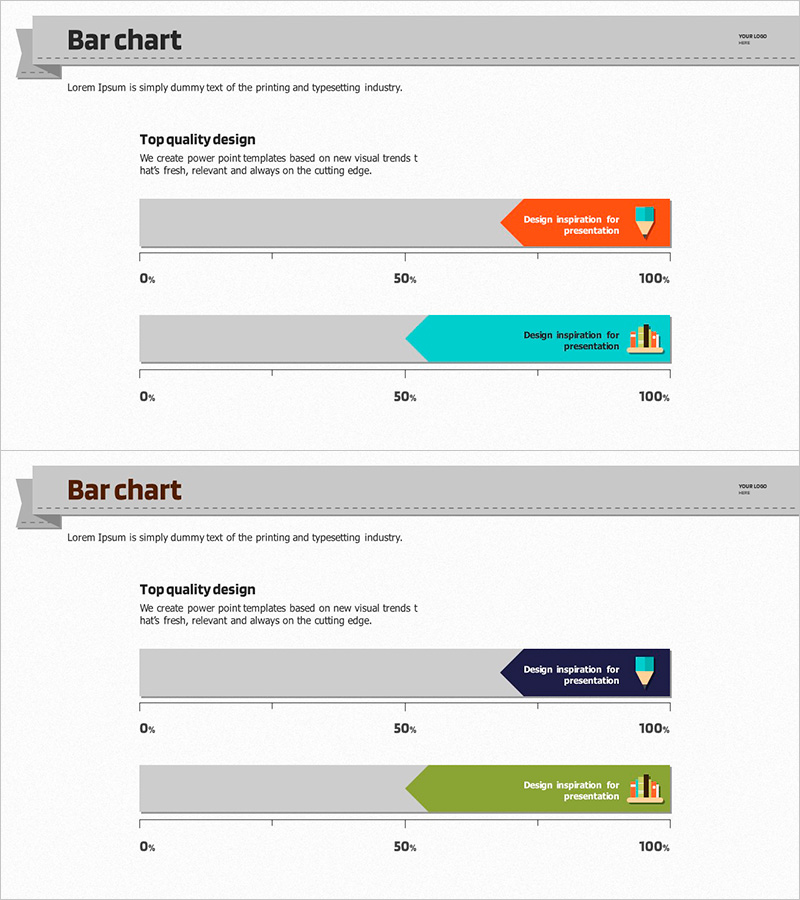
A horizontal bar chart PowerPoint slide optimized for market analysis and marketing strategy presentations. Orange and cyan arrow-shaped highlight bars clearly distinguish two data series, with a 0%-100% scale for intuitive ratio comparison. The 16:9 widescreen format with 2-slide composition is ready to use immediately, effectively visualizing various numerical data such as marketing goal achievement rates, market share, and competitor comparisons. Use this presentation slide to powerfully communicate quantitative performance in your PowerPoint deck.
Usage Points
-
Main Usage
Compare and analyze marketing performance metrics, market share, competitor benchmarks, and goal achievement rates across two or more data series in horizontal orientation. The contrasting orange and cyan colors emphasize differences between items, capturing audience attention effectively.
-
How to Use
Modify each bar length to input actual numerical data and change text labels accordingly. Use both slides to represent different metrics or time-period comparisons. Colors and icons can be customized to match your brand guidelines while maintaining the arrow-highlight design structure.
-
Recommended For
Marketing managers, sales directors, executives preparing reports, market research analysts, and business strategy planning teams. Ideal for quarterly performance presentations, market analysis reports, competitive analysis documents, and marketing strategy proposals.
-
Slide Structure
2-slide composition with 2 horizontal bar graphs per slide. The top slide displays orange and cyan arrow-shaped bars on a 0%-100% scale, while the bottom slide uses the same structure for different data. Text labels and icons are positioned beside each bar to enhance information delivery and visual clarity.
Related Products
-

Volume Template for Horizontal Bar Chart – Market Status and Competitive Edge
#Market and Competitor Analysis #Graph #Market Status
-

Idea Derivation Bar Chart Template – Market and Competitor Analysis
#Market and Competitor Analysis #Marketing Plan and Strategy #Graph
-

Bar Graph Visualization of Pet Data
#Market and Competitor Analysis #Financial Plans and Performance #Graph
-

Segmented Horizontal Bar Graph for Market Overview – Five Color Template
#Market and Competitor Analysis #Graph #Market Status
