Run Effect Line Chart for Market and Competitor Analysis – Gain Competitive Edge
RJ0800021_17
- Last Update 08/05/2025
- File Size 2.8MB
- # of Slides 2
- File Format PPTX
- Slide Ratio 16:9
- Color
Keywords
About the Product
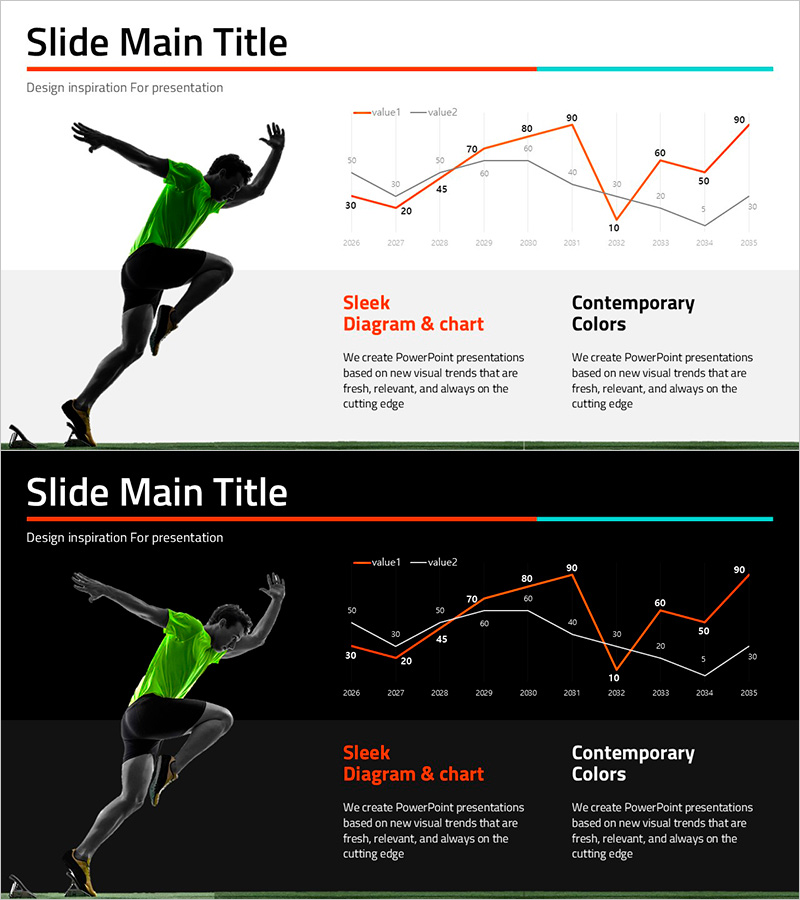
A PowerPoint slide featuring a dynamic line chart for market and competitor analysis. The design combines an energetic running effect illustration on the left with a dual-line graph comparing two key metrics (value1 and value2) on the right. Orange and gray lines distinguish between data series, while a dedicated text area explains competitive positioning strategy. This 16:9 widescreen, 2-slide template is ready to use immediately in investor presentations, business reports, and strategic planning meetings to visualize competitive advantage analysis.
Usage Points
-
Main Usage
Demonstrates competitive positioning by comparing market trends and competitor performance through dual-line visualization. Effectively communicates competitive strength to investors, executives, and partners, serving as evidence-based support for strategic decision-making and business planning.
-
How to Use
Replace the text area on the left with your competitive advantage message or key insight. Update the line chart legend and data values with your actual market and competitor metrics. The running effect illustration emphasizes momentum and growth, making it ideal for performance announcements or growth strategy sections.
-
Recommended For
Ideal for business reports, investor presentations (IR materials), strategic planning meetings, executive briefings, and investment pitches. Also suitable for marketing plans, proposals, and business plans where competitive analysis and market positioning sections are needed.
-
Slide Structure
Two-slide layout with a three-column design: left side features the running effect illustration, center displays the dual-line chart with 2026-2035 timeline, and right side contains text explanation area. Title and subtitle appear at the top, with data labels and color legend positioned at the bottom for clear information hierarchy.
Related Products
-

Air-Led Transport Strategy Direction – Future-Oriented Business
#Technical Approach #Market and Competitor Analysis #Diagram
-

Market Trends Comparison Graph – Emphasizing Technical Advantage
#Technical Approach #Market and Competitor Analysis #Graph
-

Market Analysis Chart for Frequently Used Transportation Methods When Traveling
#Business Strategy #Market and Competitor Analysis #Graph
-

Market Trend Analysis of Eco Farming Data Visualization
#Market and Competitor Analysis #Graph #Competitive Advantage
