Vertical Bar Graph Competitors and Competitive Advantage Chart – Emphasizing Market Analysis and Competitiveness
RJ0600030_7
- Last Update 06/28/2025
- File Size 1.4MB
- # of Slides 2
- File Format PPTX
- Slide Ratio 16:9
- Color
Keywords
- #Content-Based Slides
- #Design-Based Slides
- #Market and Competitor Analysis
- #Financial Plans and Performance
- #Graph
- #Other
- #Competitive Advantage
- #Sales and Revenue
- #16:9
- #vertical bar chart PowerPoint
- #bar graph PowerPoint slide
- #comparison chart template
- #competitive analysis graph
- #market performance data visualization
About the Product
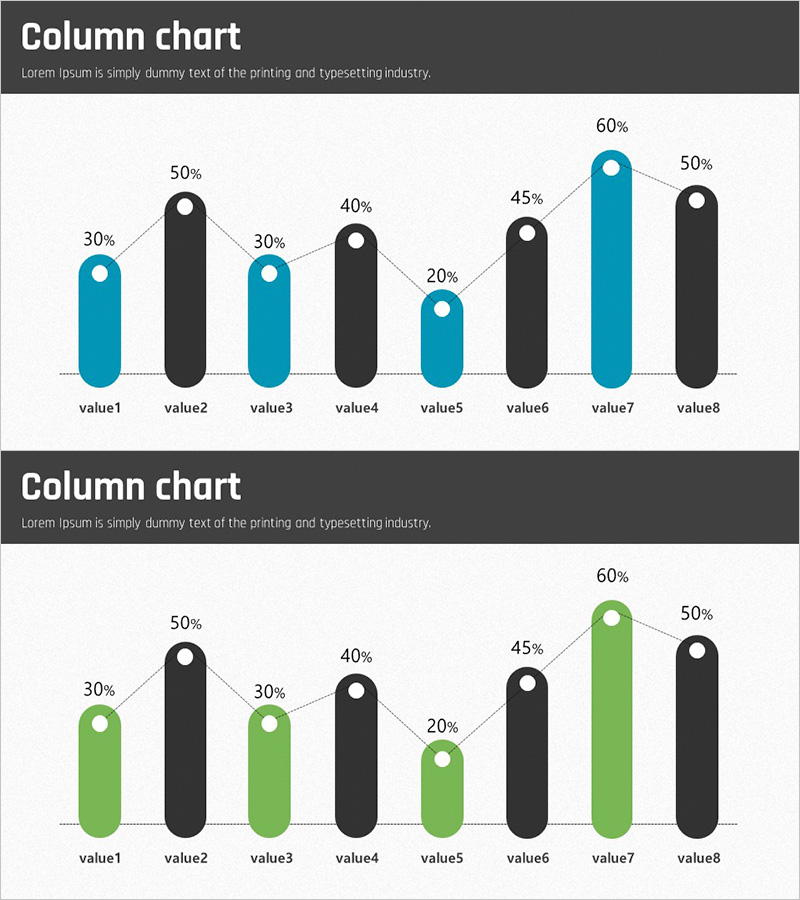
A vertical bar chart PowerPoint slide designed to compare competitive analysis and market performance at a glance. The slide features eight data items displayed in contrasting teal and black colors with a horizontal baseline, making numerical comparisons clear and impactful. Percentage labels appear above each bar for precise data communication, enabling immediate use in presentations emphasizing your company's competitive advantage and market share. The 2-slide set includes color variations (teal and green) to match your presentation tone.
Usage Points
-
Main Usage
This slide visualizes quantitative data such as competitive benchmarking, market share, and revenue comparisons in a clear, impactful format. It is ideal for investor presentations, executive briefings, and market analysis reports where key metrics need to be highlighted.
-
How to Use
Simply replace the bar heights and percentage labels with your own data for immediate use. Assign teal to your company and black to competitors or prior-period data to maximize comparative impact. Select the color variation from slide 2 that best matches your presentation theme.
-
Recommended For
Recommended for executive reports, investor relations presentations, sales pitches, market analysis briefings, and quarterly or annual performance reviews. Particularly effective when emphasizing competitive advantages or supporting data-driven decision-making.
-
Slide Structure
Each slide contains a title area and one vertical bar chart with eight items. Bars are displayed in contrasting teal and black colors with percentage labels and circular markers at the top for high readability. A baseline and legend support data interpretation.
Related Products
-

Sales and Net Income Graph – Visualizing Business Performance
#Market and Competitor Analysis #Financial Plans and Performance #Graph
-

Collaboration Silhouette Diagram – Visual Tool for Customer Analysis
#Market and Competitor Analysis #Graph #Other
-

Donut Chart by Lighting Sales Rankings – Market Data Analysis
#Market and Competitor Analysis #Financial Plans and Performance #Diagram
-

Graph Comparing Performance by Major Business Divisions - Efficient Financial Planning
#Market and Competitor Analysis #Financial Plans and Performance #Graph
