Analysis of Aerobic and Muscular Exercise – Market Share Visualization
RJ0800021_16
- Last Update 08/05/2025
- File Size 0.5MB
- # of Slides 2
- File Format PPTX
- Slide Ratio 16:9
- Color
Keywords
About the Product
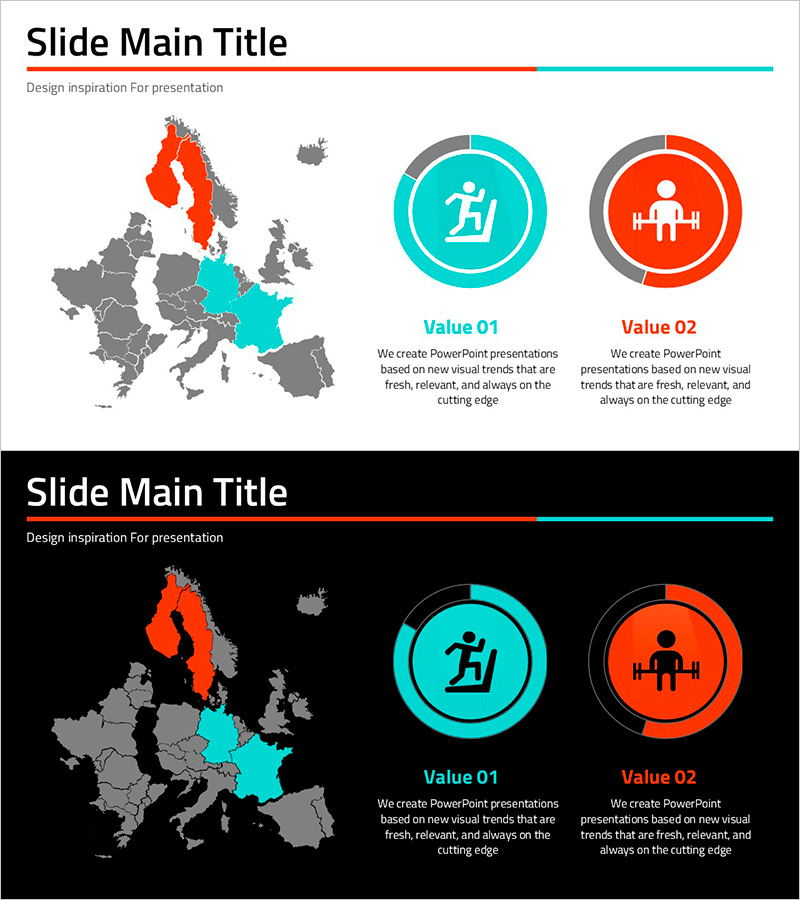
A PowerPoint slide deck that visualizes market share distribution across Europe and Asia using dual donut charts and an interactive world map. The design combines geographic representation with proportional data visualization, using red and cyan color coding to distinguish two market categories. Each donut chart includes embedded icons for quick category identification. This 2-slide presentation template is ready to use in business reports, market analysis decks, and executive presentations without additional design work.
Usage Points
-
Main Usage
Effectively communicate regional market distribution, sales volume by geography, or customer concentration across continents using combined donut charts and map visualization. Ideal for executive summaries, quarterly business reviews, market entry strategies, and competitive analysis presentations where geographic and proportional data must be presented simultaneously.
-
How to Use
Slide 1 displays the world map with highlighted regions in red and cyan. Slide 2 shows corresponding donut charts for each region with embedded icons and percentage labels. Replace sample data with your actual figures, customize icons to match your categories, and adjust colors to align with corporate branding. All elements are fully editable in PowerPoint.
-
Recommended For
Marketing managers, business analysts, executives, consultants, and investment professionals presenting regional performance metrics, market penetration analysis, or global expansion strategies. Particularly effective for quarterly earnings reports, market feasibility studies, and international business development presentations.
-
Slide Structure
Slide 1: World map with two highlighted regions (red and cyan) plus legend and title. Slide 2: Two donut charts (Value 01 and Value 02) with embedded icons, percentage labels, and descriptive text. Total 2 slides in 16:9 widescreen format, fully editable PPTX file.
Related Products
-

Sales Performance Comparison Slide – Market Analysis and Competitive Edge
#Market and Competitor Analysis #Graph #Future Outlook
-

Visualizing Sales and Meeting Progress Over Time
#Market and Competitor Analysis #Financial Plans and Performance #Graph
-

Highlighted Curved Graph for Market Analysis
#Market and Competitor Analysis #Financial Plans and Performance #Graph
-

Analysis of Successful Revenue Performance Slide – Business Strategy and Financial Results
#Business Strategy #Financial Plans and Performance #Graph
