Connected Scheme Diagram – Business Strategy and Timeline
RJ0800020_13
- Last Update 08/05/2025
- File Size 0.2MB
- # of Slides 2
- File Format PPTX
- Slide Ratio 16:9
- Color
Keywords
- #Content-Based Slides
- #Design-Based Slides
- #Business Strategy
- #Diagram
- #Step-by-Step Schedule Plan
- #Implementation Framework
- #Cluster
- #Chain Diagram
- #16:9
- #connected diagram PowerPoint
- #business strategy slide template
- #cluster diagram presentation
- #phased planning PPT
- #how to create connected diagram in PowerPoint
About the Product
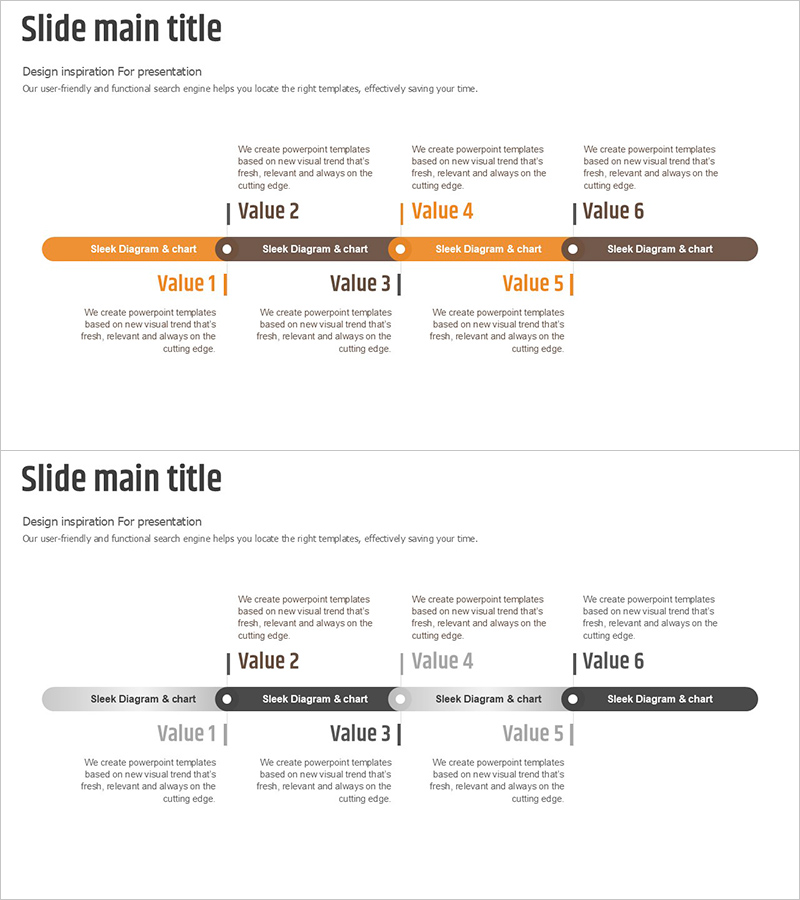
A connected diagram PowerPoint slide that visualizes business strategy and phased implementation timelines. The structure features a central hub with six nodes radiating outward, clearly expressing interconnected relationships between each element. The two-tone color scheme of orange and gray distinguishes primary and secondary items, while circular nodes and connecting lines intuitively convey process flow. This presentation template effectively explains complex relationship structures in business plans, strategy documents, and executive presentations.
Usage Points
-
Main Usage
Visually represent business strategy, phased timelines, and interconnected project components, enabling audiences to intuitively understand complex system structures and strategic relationships.
-
How to Use
Set the central hub as your core strategy and input detailed implementation items into the six nodes. Edit node text and colors to distinguish priorities or categories, and highlight nodes sequentially during presentation to match your narrative flow.
-
Recommended For
Executives, project managers, strategy planning teams, and business development professionals presenting business plans, strategic planning meetings, investor presentations, and organizational restructuring proposals.
-
Slide Structure
Two-slide set featuring a 6-node connected diagram in orange accent tone on the first slide and gray tone on the second. Each circular node connects to the central hub via connecting lines, with text input areas positioned below each node for customization.
Related Products
-

Slide on the Process of Diminishing Sensation - Business Strategies
#Business Strategy #Diagram #Step-by-Step Schedule Plan
-

Step-by-step Schedule Plan Farming Icon - Green Purple
#Business Strategy #Diagram #Step-by-Step Schedule Plan
-

Systemic Flow Layered Structure - Visualizing Business Strategy
#Business Strategy #Diagram #Step-by-Step Schedule Plan
-

Business Procedure Orange Yellow Diagram
#Business Strategy #Diagram #Step-by-Step Schedule Plan
