Slide on the Process of Diminishing Sensation - Business Strategies
RL0100087_2
- Last Update 01/23/2025
- File Size 5.9MB
- # of Slides 2
- File Format PPTX
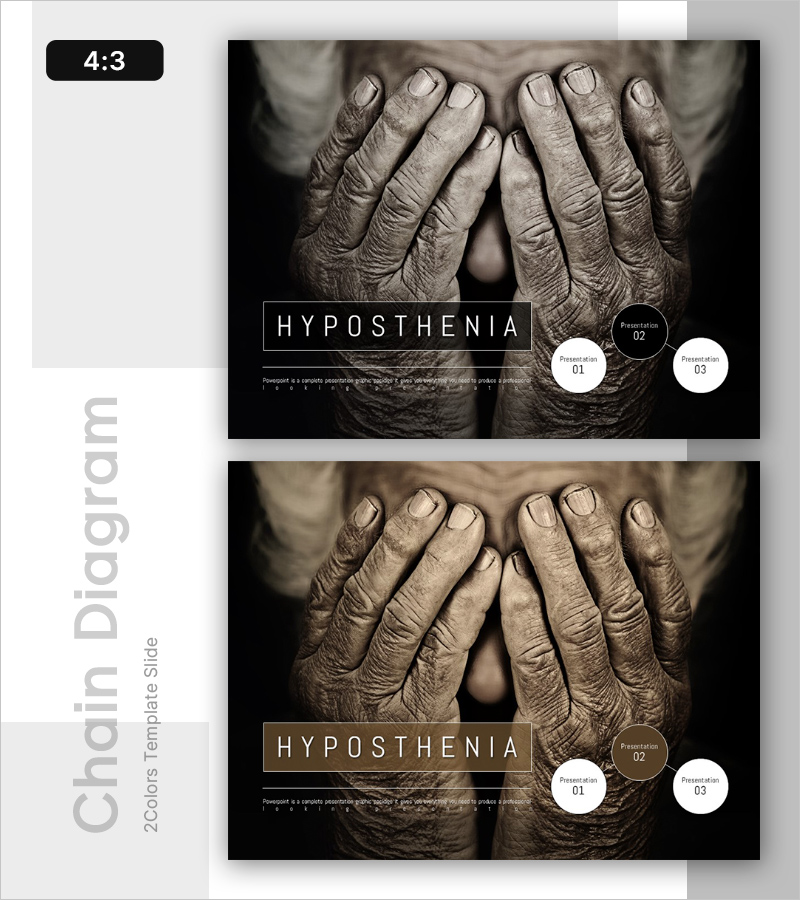
- Slide Ratio 4:3
- Color
Keywords
About the Product
A connected diagram PowerPoint slide visualizing the process of sensory diminishment through a three-node circular layout. The design features a neutral grayscale background with white circular nodes linked by directional arrows, ideal for illustrating business strategies, phased planning, and sequential processes. Provided as a 2-slide set in 4:3 aspect ratio, each node accepts text input for immediate presentation use. Highly effective for medical, social science, and business presentations explaining progressive change, declining trends, or step-by-step procedures.
Usage Points
-
Main Usage
Clearly illustrates sequential progression, cause-and-effect relationships, and temporal change. Use to explain sensory decline, functional deterioration, business phases, project timelines, or any three-stage transformation requiring visual clarity.
-
How to Use
Enter stage names, descriptions, and metrics into each circular node; directional arrows establish causal relationships. Apply in medical presentations, business reports, and educational materials as a process explanation slide. Customize colors to match brand guidelines or presentation themes.
-
Recommended For
Healthcare professionals explaining disease progression, business leaders presenting phased strategies, educators illustrating learning processes, management consultants reporting change initiatives, researchers visualizing experimental stages.
-
Slide Structure
2-slide set. Both slides feature three white circular nodes arranged in triangular formation with connecting arrows. Each node serves as a text input area; title and description text fields appear centrally or at the bottom. Delivered in 4:3 aspect ratio PPTX format.
Related Products
-

Connected Scheme Diagram – Business Strategy and Timeline
#Business Strategy #Diagram #Step-by-Step Schedule Plan
-

Science Experiment Plan Diagram – Step-by-Step Implementation System
#Business Strategy #Diagram #Step-by-Step Schedule Plan
-

Step-by-step Schedule Plan Farming Icon - Green Purple
#Business Strategy #Diagram #Step-by-Step Schedule Plan
-

Systemic Flow Layered Structure - Visualizing Business Strategy
#Business Strategy #Diagram #Step-by-Step Schedule Plan
