Cost-of-Treatment Plan Slide for Financial Planning - Efficient Management
RJ0800019_19
- Last Update 08/04/2025
- File Size 3.5MB
- # of Slides 2
- File Format PPTX
- Slide Ratio 16:9
- Color
Keywords
About the Product
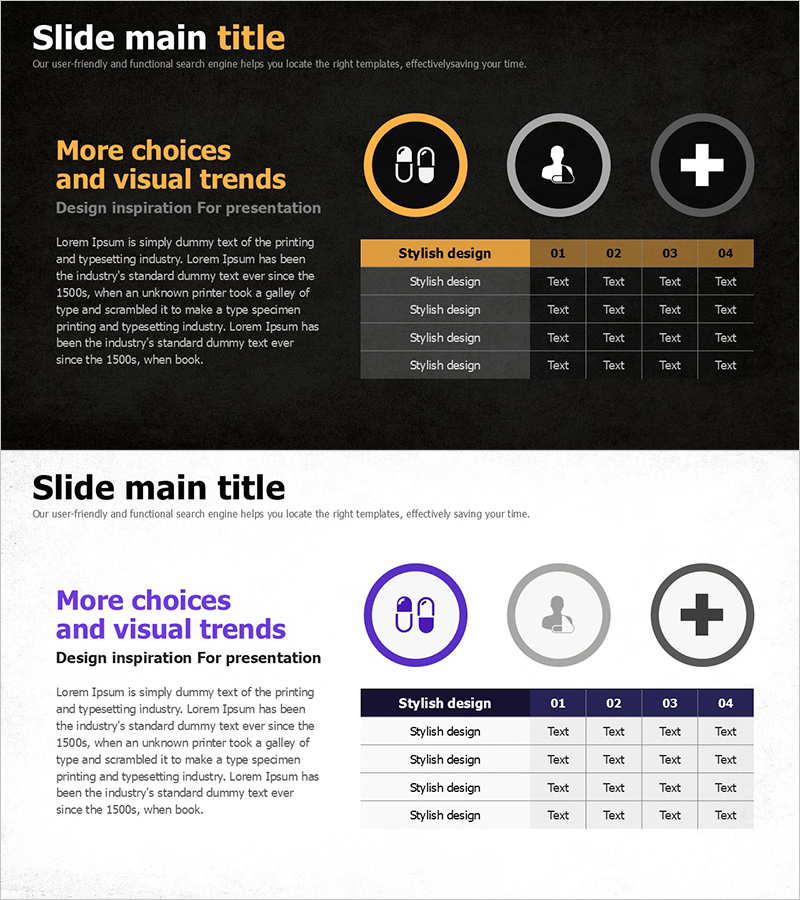
A data-driven PowerPoint slide template for presenting financial information and cost comparisons in a structured table format. The 2-slide deck features a dark background with gold accent colors, combining a left text area for descriptions with a right-aligned 4-column table for numerical data entry. Ideal for financial reports, budget presentations, investment pitches, and cost analysis meetings in healthcare, pharmaceutical, and financial services industries. The layout supports side-by-side comparison of multiple cost items, enabling clear visualization of budget allocation and financial performance metrics.
Usage Points
-
Main Usage
Present financial planning, budget management, and cost comparison analysis through structured data visualization. The table layout enables side-by-side comparison of multiple cost items, making it ideal for communicating investment ROI, cost efficiency, and budget allocation decisions to stakeholders.
-
How to Use
Enter cost item names, descriptions, and analysis details in the left text area. Input numerical data, percentages, and time-period information in the 4-column table. Customize column headers to reflect comparison criteria such as fiscal year, department, or scenario, transforming the slide into a decision-support tool.
-
Recommended For
CFOs, financial analysts, project managers, healthcare administrators, and pharmaceutical marketing teams presenting budget reviews, cost-benefit analyses, and investment justification. Suitable for financial reports, investor presentations, and executive briefing decks.
-
Slide Structure
2-slide deck: dark background with gold accent circular icons (pill, person, plus symbol) + left text area (title and description) + right 4-column table (header row plus 4 data entry rows). 16:9 widescreen format optimized for projector and online presentations.
Related Products
-

Green & Gray Template Wide Table – Visualizing Financial Plans and Performance
#Financial Plans and Performance #Diagram #Cash Flow Statement
-

Sales and Revenue Planning with Nature Night View Table Chart
#Financial Plans and Performance #Diagram #Cash Flow Statement
-

Annual Sales and Profit Analysis Table – Key to Financial Planning
#Financial Plans and Performance #Diagram #Cash Flow Statement
-

Green Orange Table Slide – Financial Insights at a Glance
#Financial Plans and Performance #Diagram #Cash Flow Statement
