Visualizing Financial Performance with Cash Flow Statement Table
RM0100008_32
- Last Update 01/27/2025
- File Size 0.4MB
- # of Slides 2
- File Format PPTX
- Slide Ratio 16:9
- Color
Keywords
- #Content-Based Slides
- #Design-Based Slides
- #Financial Plans and Performance
- #Diagram
- #Cash Flow Statement
- #Sales and Revenue
- #Table
- #16:9
- #cash flow statement PowerPoint slide
- #cash flow table template
- #financial data visualization slide
- #comparison table PPT
- #how to create cash flow statement in PowerPoint
About the Product
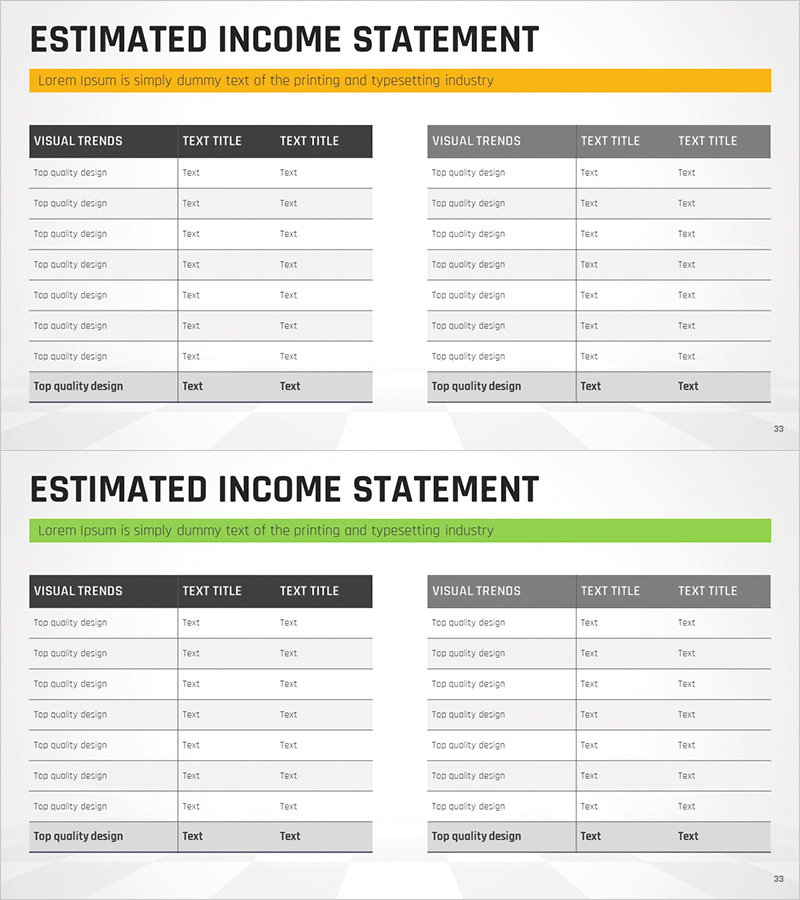
A professional cash flow statement PowerPoint slide designed to visualize financial performance with clarity and precision. The two-column table layout enables side-by-side comparison of cash flows across different periods, with clearly separated header and data rows for easy data entry. The gray and black color scheme conveys financial credibility and is suitable for investor presentations, financial reports, and business plan decks. This 16:9 widescreen slide set includes 2 slides with fully editable table cells, allowing you to input actual company financial data directly into the template.
Usage Points
-
Main Usage
Communicate financial performance and cash flow trends through structured numerical data. The table format clearly presents operating, investing, and financing activities, enabling stakeholders and investors to quickly understand the company's cash position and liquidity situation.
-
How to Use
Insert into the financial section of investor presentations, annual reports, or business plans to explain cash flow status. Use for period-over-period comparisons or to project future cash flows. The clear table structure helps audiences grasp financial metrics without confusion.
-
Recommended For
CFOs, financial analysts, investor relations teams, business development managers, and bank loan officers. Particularly effective for investor pitches, financial disclosures, executive briefings, and fundraising presentations where cash flow analysis is critical.
-
Slide Structure
2-slide set with two-column table layout on each slide. Header row features black background with white text; data rows use gray background with black text for contrast. Three columns per table (line item, period 1, period 2) optimize the layout for period-to-period comparison and analysis.
Related Products
-

Origami Presentation Template Section Table – Showcase Financial Performance
#Financial Plans and Performance #Diagram #Cash Flow Statement
-

Spring Background Table – Visualizing Financial Performance!
#Financial Plans and Performance #Diagram #Cash Flow Statement
-

Annual Sales and Profit Analysis Table – Key to Financial Planning
#Financial Plans and Performance #Diagram #Cash Flow Statement
-

Sales and Revenue Planning with Nature Night View Table Chart
#Financial Plans and Performance #Diagram #Cash Flow Statement
