Red Purple Table Chart for Cash Flow Visualization
RJ0500021_25
- Last Update 06/12/2025
- File Size 0.2MB
- # of Slides 2
- File Format PPTX
- Slide Ratio 16:9
- Color
Keywords
About the Product
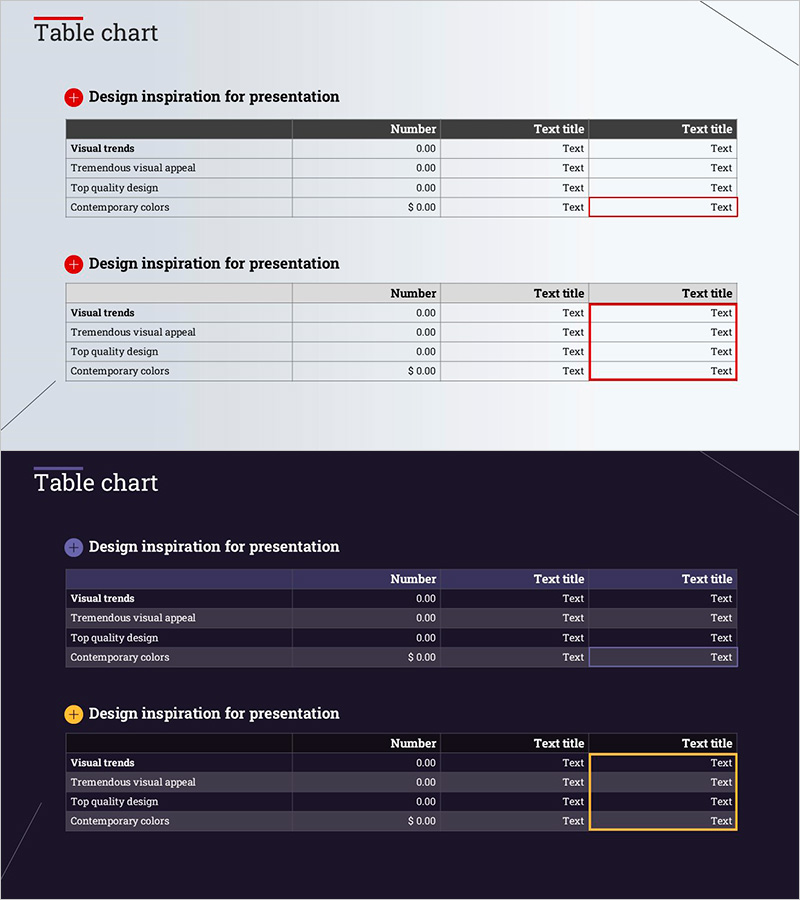
This slide features a Red Purple color combination table chart designed to effectively convey sales and revenue data. The clean and modern vertical table layout aids in easy comprehension, making it suitable for business meetings or financial reports. The layout offers a visual stability with a clearly defined title area and horizontally aligned data sections. It is particularly useful for emphasizing financial planning data, infused with the theme of 'success', making it effective for showcasing successful business results. The text and numeric areas can be easily replaced, and the editing difficulty is rated as 'easy'.
Usage Points
-
Main Usage
- This template is primarily utilized for presenting sales and revenue data in a clear and structured manner during business meetings or financial presentations, allowing stakeholders to make informed decisions based on data insights.
-
How to Use
- It can be employed in various scenarios such as internal reports, strategic planning sessions, or client presentations, where a visual representation of financial information is essential to underscore key performance indicators.
-
Recommended For
- This template is particularly beneficial for financial analysts, business managers, and team leaders who need to communicate complex data effectively to their audience during meetings or strategic discussions.
-
Slide Structure
- The overall structure consists of a vertical table layout that organizes information logically, including a title section for context and aligned data segments that facilitate easy comparison and analysis of financial metrics.
Related Products
-

Origami Presentation Template Section Table – Showcase Financial Performance
#Financial Plans and Performance #Diagram #Cash Flow Statement
-

Spring Background Table – Visualizing Financial Performance!
#Financial Plans and Performance #Diagram #Cash Flow Statement
-

Visualizing Financial Performance with Cash Flow Statement Table
#Financial Plans and Performance #Diagram #Cash Flow Statement
-

Key Metrics – Effective Financial Analysis Slide
#Financial Plans and Performance #Diagram #Cash Flow Statement
