World Map Distribution Chart – Global Market Analysis Tool
RJ0800016_10
- Last Update 08/04/2025
- File Size 0.8MB
- # of Slides 2
- File Format PPTX
- Slide Ratio 16:9
- Color
Keywords
- #Content-Based Slides
- #Design-Based Slides
- #Company Introduction
- #Market and Competitor Analysis
- #Other
- #Global Network
- #Market Analysis
- #Map
- #16:9
- #world map distribution chart PowerPoint
- #global market analysis slide
- #regional data visualization PPT
- #how to create a world map chart in PowerPoint
- #international business presentation template
About the Product
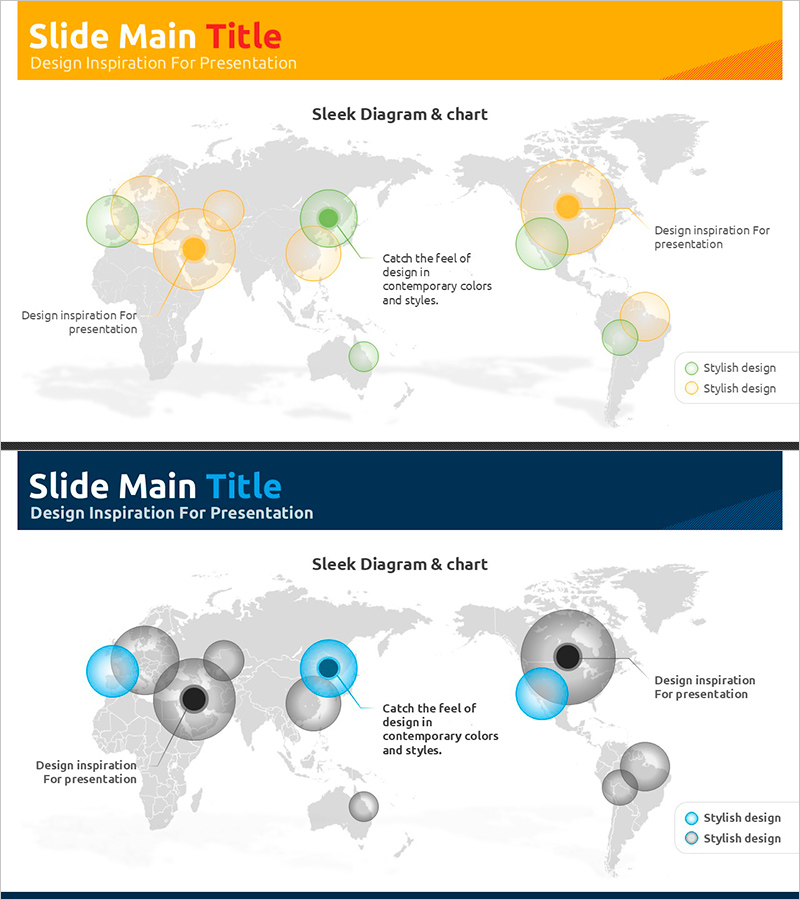
A world map distribution chart PowerPoint slide optimized for global market analysis and international business presentations. This slide deck visualizes regional business performance, customer distribution, and partnership networks across continents using circular diagrams overlaid on a world map. The 2-slide set features warm orange and cool green color palettes that make regional data comparisons intuitive and visually engaging. Ample text input areas allow you to add region names, metrics, and descriptions for each data point. Formatted in 16:9 widescreen ratio, it integrates seamlessly into modern presentation environments. Fully editable PPTX format enables quick customization for investor pitches, executive reports, and international business meetings.
Usage Points
-
Main Usage
Visualize global market distribution, regional sales performance, international customer base, and partnership networks on a geographic foundation. Enhances investor presentations, executive briefings, and international business meetings by enabling clear regional comparisons and strategic insights.
-
How to Use
Insert into company profile sections covering global networks, market analysis reports showing regional breakdowns, and business plans detailing expansion strategies. Customize each circular diagram with region names, revenue figures, customer counts, or market share percentages. Adjust colors to highlight priority regions or data categories.
-
Recommended For
Global enterprise executives, international marketing managers, overseas business development teams, investment relations professionals, and management consultants who need to communicate regional performance data clearly and persuasively.
-
Slide Structure
Two-slide layout with world map background and 3–5 circular diagrams positioned across continents. Each slide features a header area for title and subtitle, a central map zone for data visualization, and a right-side legend area for category descriptions, creating clear information hierarchy.
Related Products
-

Global Map Visualizing Country Distribution - Global Network Analysis
#Company Introduction #Market and Competitor Analysis #Other
-

Idea Presentation Template Wide Map – Global Market Analysis
#Company Introduction #Market and Competitor Analysis #Other
-

Animal Distribution Map – Market and Competitive Analysis
#Company Introduction #Market and Competitor Analysis #Other
-

Annual Crime Rate by Country Visualization PowerPoint Template
#Company Introduction #Market and Competitor Analysis #Other
