Visualizing Design Trends with Table Format – Green Orange
RJ0800015_17
- Last Update 08/04/2025
- File Size 1.6MB
- # of Slides 2
- File Format PPTX
- Slide Ratio 16:9
- Color
Keywords
About the Product
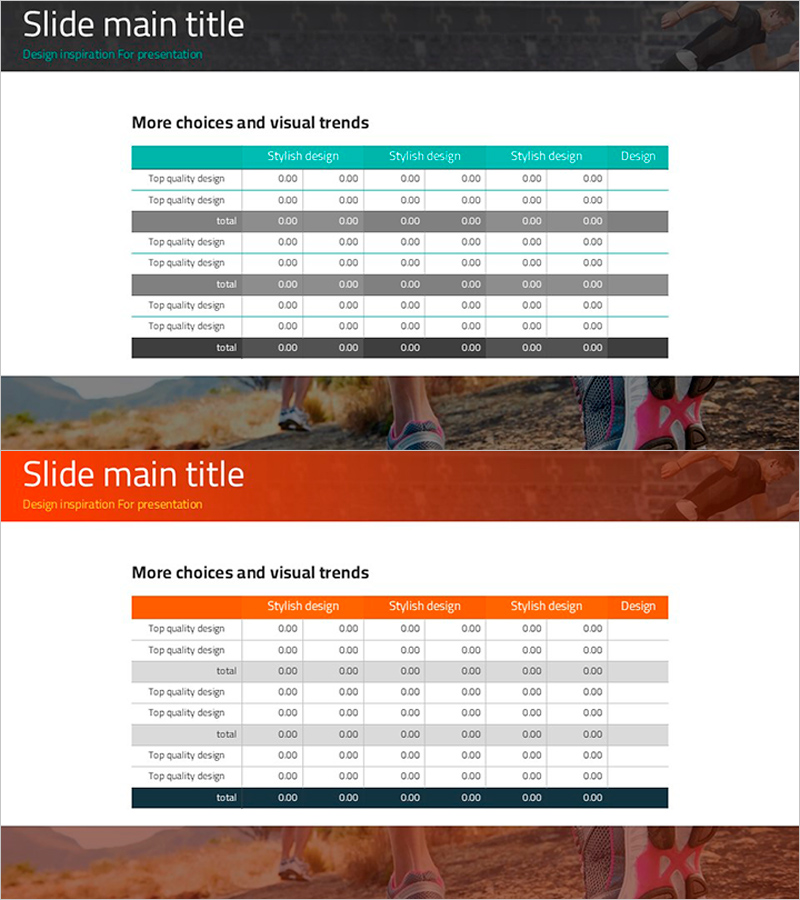
A 6-column data table PowerPoint slide designed for presenting design trends and market data with visual clarity. Features teal and orange headers that distinguish three data sections, with each section displaying six comparable items in row format. The slide includes a title area and background imagery for visual emphasis, enhancing presentation credibility. The 2-slide set accommodates multiple datasets and is optimized for 16:9 widescreen format. Ready-to-use for marketing, planning, and analytical presentations.
Usage Points
-
Main Usage
Organize marketing trends, market analysis, product comparisons, and other datasets in table format for clear audience communication. The 6-column and multi-row structure systematizes complex information, while color-coded headers emphasize section hierarchy.
-
How to Use
Select table cells in the slide master to input text and numerical data. Maintain header colors (teal and orange) while adjusting data row backgrounds as needed. Background imagery can be replaced or removed based on presentation requirements.
-
Recommended For
Ideal for marketing strategists, data analysts, executive reports, product comparison presentations, market research findings, and trend analysis sessions. Particularly effective for B2B presentations requiring structured quantitative data delivery.
-
Slide Structure
Two-slide set with each slide containing a title area with background imagery and a 6-column by multi-row table. First slide features teal header, second slide features orange header, allowing representation of different datasets. Optimized for 16:9 widescreen ratio.
Related Products
-

Table Slide for Garden Industry Status Analysis
#Market and Competitor Analysis #Financial Plans and Performance #Diagram
-

Pixel Graphical Maps and Tables - Visualizing Global Network
#Company Introduction #Market and Competitor Analysis #Diagram
-

Travel Expense Table – Essential Slide for Budget Planning
#Financial Plans and Performance #Diagram #Capital Requirements
-

Eucalyptus Table Presentation Slide
#Financial Plans and Performance #Diagram #Budget
