Muscle Mass Change Graph – Market Analysis Presentation
RJ0800015_14
- Last Update 08/04/2025
- File Size 8.2MB
- # of Slides 2
- File Format PPTX
- Slide Ratio 16:9
- Color
Keywords
- #Content-Based Slides
- #Design-Based Slides
- #Market and Competitor Analysis
- #Graph
- #Market Status
- #Competitive Advantage
- #Column
- #Grouped Column
- #16:9
- #grouped bar chart PowerPoint
- #horizontal vertical bar graph slide
- #5-item comparison chart
- #market analysis PowerPoint template
- #data comparison presentation slide
About the Product
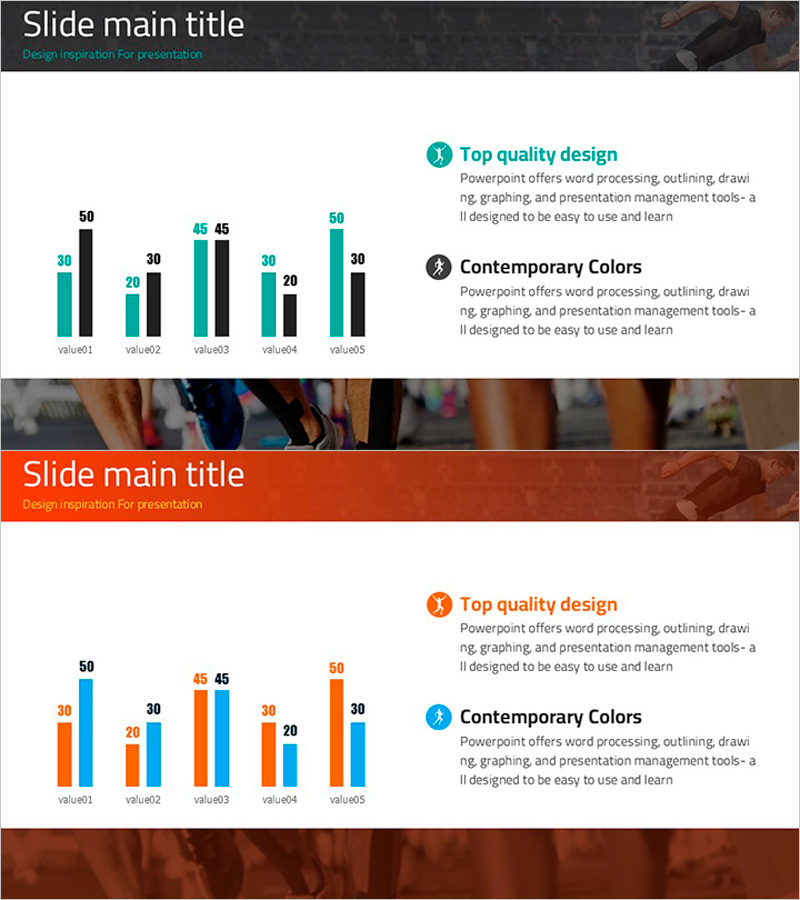
A grouped bar chart PowerPoint slide optimized for market analysis and performance comparison presentations. This slide deck offers both horizontal and vertical bar formats, allowing flexible data visualization options. The teal and black two-tone design clearly displays numerical comparisons across five items, with value labels positioned above each bar for precise data communication. Instantly applicable to business reports, marketing plans, pitch decks, and executive presentations.
Usage Points
-
Main Usage
Visualizes numerical data for market analysis, product performance comparison, and departmental results benchmarking. The grouped structure enables simultaneous comparison of multiple data series, making it ideal for executive reports, marketing presentations, and quarterly performance reviews.
-
How to Use
Select either the horizontal or vertical bar format provided on the slide. Input your numerical values and the bar lengths adjust automatically while maintaining the existing design. Customize colors and labels to match your company branding, or lock the chart as an image for presentation stability.
-
Recommended For
Marketing teams presenting market analysis, sales teams reporting performance metrics, executives delivering quarterly results, consultants visualizing proposal data, and academics presenting statistical findings. Perfect for any business presentation requiring 2-5 item numerical comparisons.
-
Slide Structure
Two-slide layout: First slide features teal-based vertical bar chart (5 items, 2 series); second slide displays black-based horizontal bar chart (5 items, 2 series). Both include title area, legend, and value labels in 16:9 widescreen format.
Related Products
-

Bundled Charts for Infinite Energy Analysis
#Market and Competitor Analysis #Graph #Market Status
-

The Importance of Modern People's Health Care – Insights from Market Analysis
#Market and Competitor Analysis #Graph #Other
-

Analysis of Changes in Avocado Purchases with Horizontal and Vertical Bar Graphs
#Market and Competitor Analysis #Graph #Market Status
-

Horizontal Bar Graph Slide Template for European Tourism Demand Survey
#Market and Competitor Analysis #Graph #Market Status
