Message Strategy in Figure – Data Visualization Diagram
RJ0800012_11
- Last Update 08/03/2025
- File Size 2.9MB
- # of Slides 2
- File Format PPTX
- Slide Ratio 16:9
- Color
Keywords
About the Product
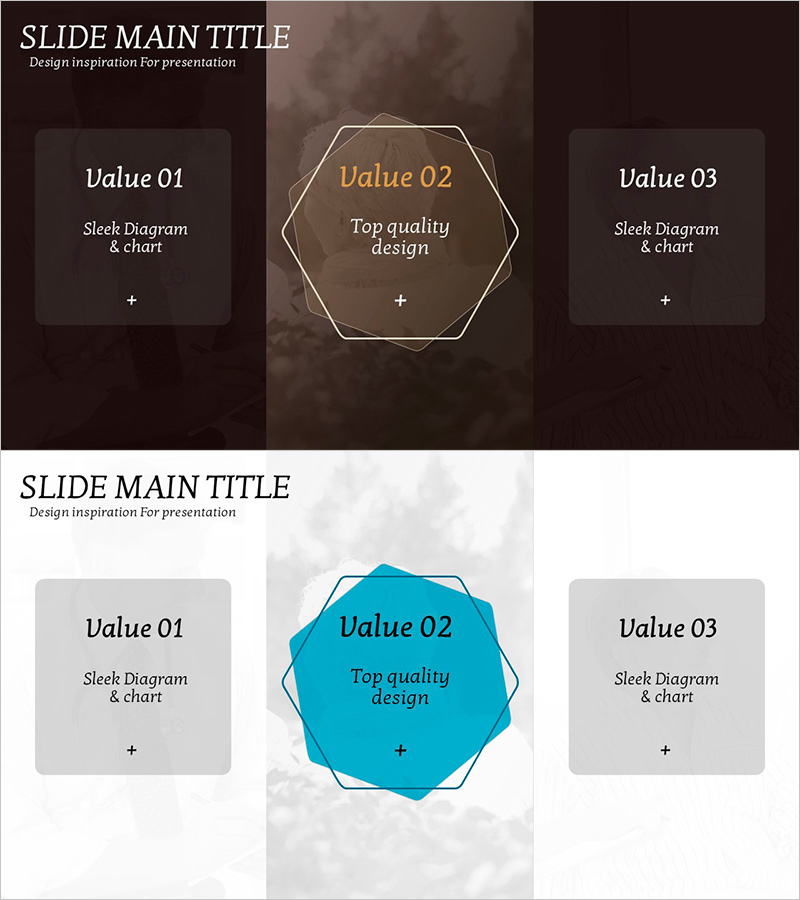
A PowerPoint slide featuring three hexagon shapes to emphasize core messages and strategic points. The central gold hexagon highlights the primary value, while the flanking dark shapes organize supporting information. Set against a dark brown background with white typography and gold accent colors, this design enhances presentation credibility. Ideal for expressing three key business strategies, product value propositions, or organizational core competencies. The 2-slide set offers multiple color combinations—dark brown, light gray, and turquoise—allowing you to select the palette that best matches your presentation context and audience expectations.
Usage Points
-
Main Usage
Simultaneously emphasize and compare three core values, strategies, or competencies. The central hexagon highlights the primary message while flanking shapes organize supporting information in a hierarchical structure, naturally guiding audience attention.
-
How to Use
Apply to company vision, mission, and values introductions; product feature explanations; organizational strategic objectives; or competitive advantage positioning. Edit text within each hexagon to match your presentation content, and select color combinations to adjust presentation tone and visual impact.
-
Recommended For
Executive reports, strategic planning presentations, product launch events, organizational restructuring briefings, and investor pitches. Particularly effective when presenting three balanced elements, and well-suited for consulting, finance, and technology sector presentations requiring professional visual hierarchy.
-
Slide Structure
Two-slide set: first slide features dark brown background with three gold-accent hexagons (one center, two flanking); second slide presents light gray background with three turquoise-accent hexagons. Each shape includes editable text areas, formatted in 16:9 widescreen ratio optimized for modern presentation environments and digital display.
Related Products
-

Launch Strategy Diagram for Success
#Business Vision and Strategy #Marketing Plan and Strategy #Diagram
-

Navy Red Table Slide – Clearly Visualizing Financial Performance
#Financial Plans and Performance #Diagram #Income Statement
-

Contemporary Design Presentation Template – Eye-Catching Visuals Ready to Impress
#Business Strategy #Technical Approach #Diagram
-

IT Business Detail Plan Diagram – Cluster and Connection
#Product/Service Introduction #Operational Plan #Diagram
