Wedding Preference Survey Visual Slide – Customer Analysis Application
RJ0800011_28
- Last Update 08/03/2025
- File Size 0.3MB
- # of Slides 2
- File Format PPTX
- Slide Ratio 16:9
- Color
Keywords
- #Content-Based Slides
- #Design-Based Slides
- #Market and Competitor Analysis
- #Graph
- #Text Box
- #Other
- #Customer Analysis
- #Market Overview
- #Rounded Rectangle Text Box
- #16:9
- #preference survey PowerPoint slide
- #customer analysis presentation
- #comparison data slide
- #market research PPT
- #data visualization template
About the Product
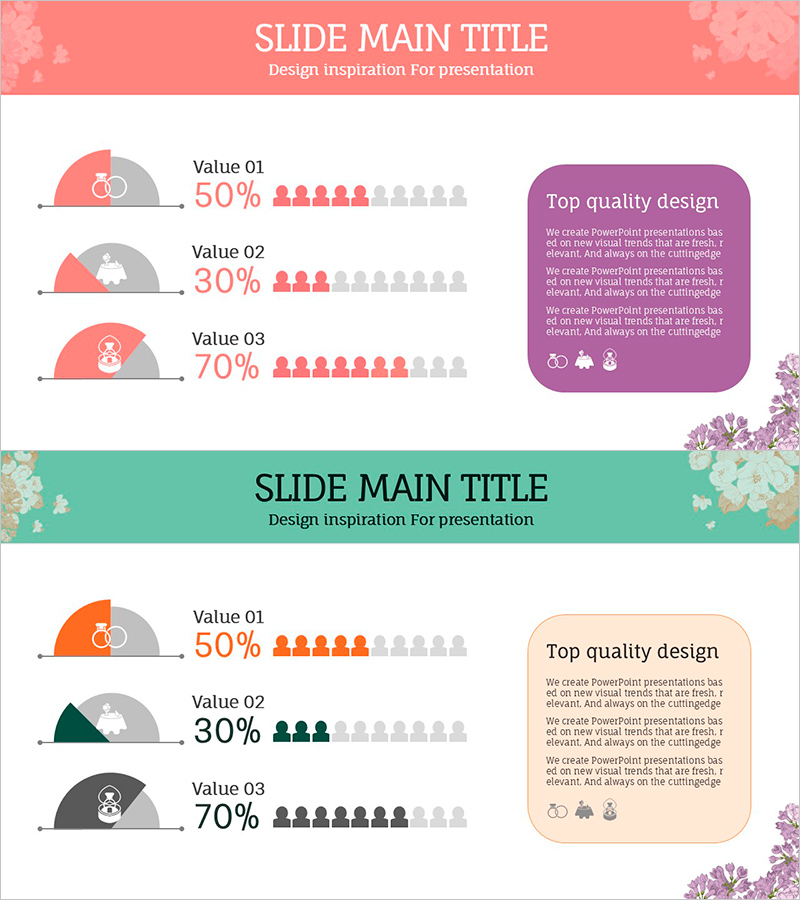
A PowerPoint slide template for visualizing customer preference survey results with a dual-layout design. The left section displays three data values (Value 01–03) with percentage figures and people icons, while the right side features a rounded-corner text box for detailed insights. The slide uses a two-column structure with coral, purple, and mint color variations to suit different presentation themes. Ideal for wedding events, market research, customer analysis, and event planning presentations. All text fields are fully editable for immediate customization and deployment.
Usage Points
-
Main Usage
Present customer preference surveys, market analysis, and event participation data in a comparative format. The combination of percentage figures and people icons enhances numerical readability and audience comprehension of survey findings.
-
How to Use
Enter survey item names in the left Value fields and update percentage numbers. Add survey methodology, background, and key insights in the right description box. Switch between color variations to match your presentation theme or brand identity.
-
Recommended For
Marketing strategy presentations, market research reports, customer analysis briefings, and event planning proposals. Highly suitable for wedding industry professionals, consumer goods companies, and service sector teams analyzing customer preferences.
-
Slide Structure
Two-slide set with each slide featuring a left comparison area for three data items and a right text box for explanations. Rounded-corner boxes clearly separate information sections, while people icon counts intuitively represent percentage values.
Related Products
-

Human Details Infographic Chart – Customer Analysis and Market Overview
#Market and Competitor Analysis #Graph #Other
-

Customer Analysis and Bell Chart – Effective Market Insights
#Market and Competitor Analysis #Graph #Other
-

Highlight Area Chart and Brief Message – Market Analysis Insights
#Market and Competitor Analysis #Graph #Other
-

Orange Green Customer Analysis and Bell Chart
#Market and Competitor Analysis #Graph #Other
