Customer Analysis with Horizontal and Vertical Bar Graphs – Market and Competitor Analysis
RJ0800011_13
- Last Update 08/02/2025
- File Size 0.3MB
- # of Slides 2
- File Format PPTX
- Slide Ratio 16:9
- Color
Keywords
- #Content-Based Slides
- #Design-Based Slides
- #Market and Competitor Analysis
- #Marketing Plan and Strategy
- #Diagram
- #Graph
- #Customer Analysis
- #Key Marketing Activities
- #Cluster
- #Column
- #Closed Cluster Diagram
- #Column Chart
- #16:9
- #horizontal bar chart PowerPoint
- #vertical bar graph slide template
- #customer analysis presentation
- #market analysis chart
- #how to create bar chart in PowerPoint
About the Product
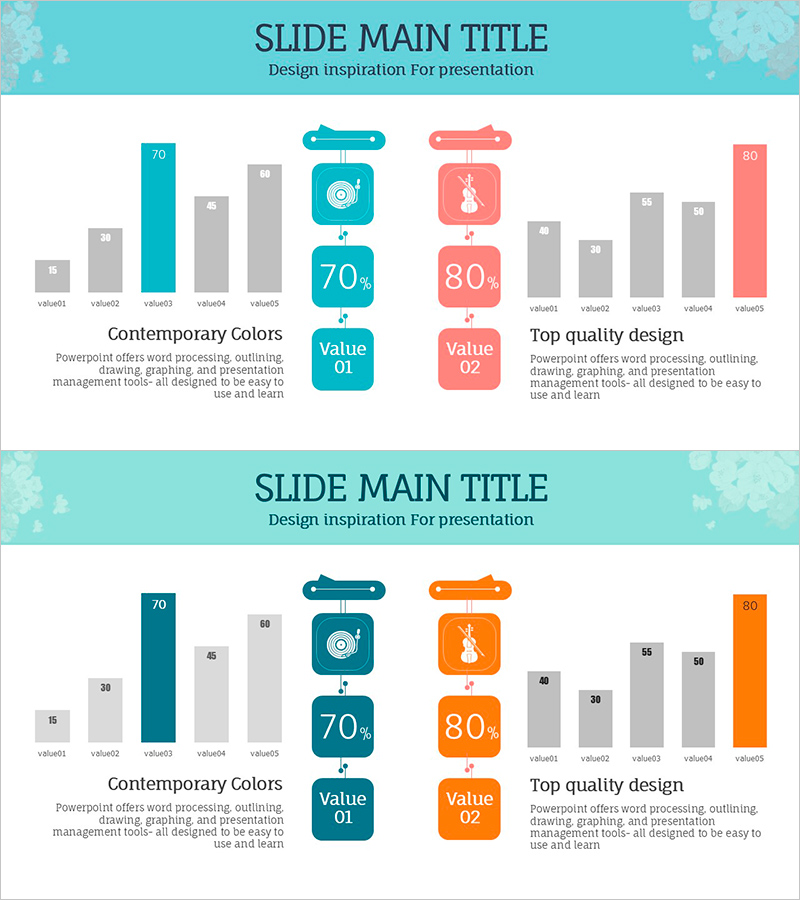
A PowerPoint slide deck featuring horizontal and vertical bar charts designed for customer analysis and market competitor analysis. The two-color scheme of teal and coral clearly distinguishes between data series, with numerical labels (70%, 80%, etc.) displayed above each bar to enhance information clarity. Comprising 2 slides, this presentation template is ready to use for customer segmentation, market share comparison, and competitive benchmarking in business reports.
Usage Points
-
Main Usage
Optimized for visualizing quantitative data such as customer segmentation, market share, and competitor performance comparison. The combination of bar length and numerical labels maximizes clarity in comparative analysis, while the dual chart types on a single slide enable effective contrast analysis.
-
How to Use
Insert into the analysis section of business reports, marketing plans, or investor presentations. Designed so that existing data automatically updates bar lengths and values; colors and labels can be customized to match brand guidelines.
-
Recommended For
Recommended for marketing professionals, executives, data analysts, and consultants who need to present quantitative evidence. Particularly effective for customer analysis, market research findings, competitive analysis, and sales performance comparison sections.
-
Slide Structure
Slide 1: Two vertical bar charts—one with teal accent bar (70%) and five gray comparison bars; another with coral accent bar (80%) and five gray comparison bars. Slide 2: Identical structure with horizontal bar charts. Each bar includes numerical labels and icons (music note and violin icons).
Related Products
-

Post-retirement Life Satisfaction Assessment Diagram – Customer Success Stories
#Market and Competitor Analysis #Marketing Plan and Strategy #Customer Success Stories
-

Customer Type Analysis Bar Graph – Data Visualization for Customer Success
#Company Introduction #Market and Competitor Analysis #Customer Success Stories
-

Campus Learning and Growing Moments – Customer Analysis and Marketing Strategy
#Market and Competitor Analysis #Marketing Plan and Strategy #Diagram
-

Cluster Diagram Visualizing Plans for Each Sporting Activity
#Product/Service Introduction #Marketing Plan and Strategy #Diagram
