Post-retirement Life Satisfaction Assessment Diagram – Customer Success Stories
RJ0600001_10
- Last Update 06/21/2025
- File Size 0.8MB
- # of Slides 2
- File Format PPTX
- Slide Ratio 16:9
- Color
Keywords
- #Content-Based Slides
- #Design-Based Slides
- #Market and Competitor Analysis
- #Marketing Plan and Strategy
- #Customer Success Stories
- #Diagram
- #Customer Analysis
- #Key Marketing Activities
- #Customer Testimonials and Feedback
- #Cluster
- #Closed Cluster Diagram
- #16:9
- #closed-form diagram PowerPoint
- #satisfaction assessment slide
- #customer success stories presentation
- #diagram PowerPoint slide
- #3-section evaluation template
About the Product
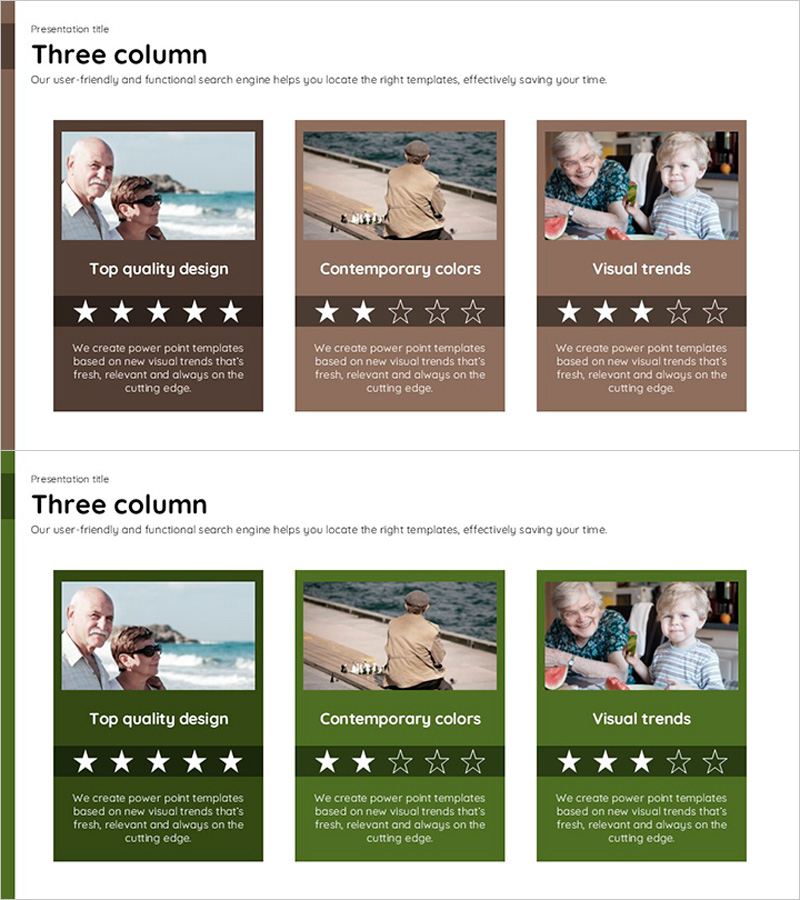
A closed-form diagram PowerPoint slide designed to visualize customer success stories and satisfaction assessments. The slide features a circular structure divided into three distinct sections, with star ratings expressing satisfaction levels for each area. Available in two color versions—brown and green—this template integrates images and text to communicate both qualitative and quantitative information simultaneously. Ideal for presentations on post-retirement life quality, customer satisfaction, service evaluations, and similar topics requiring multi-dimensional assessment.
Usage Points
-
Main Usage
Categorize customer satisfaction, service evaluations, or post-retirement life quality into three distinct sections, with star ratings expressing satisfaction levels for each. The closed-form structure enables instant comprehension of the overall assessment framework, while the image-text combination conveys both qualitative case studies and quantitative evaluations.
-
How to Use
Replace section images with customer photos or case study visuals, then customize titles and descriptive text to match your presentation topic. Adjust star counts to reflect satisfaction levels, and select either the brown or green color version to align with your brand identity.
-
Recommended For
Customer success case presentations, service satisfaction reports, post-retirement life quality assessments, customer feedback analysis, and business performance evaluation presentations. Suitable for marketing teams, customer success departments, and executive reporting materials.
-
Slide Structure
Two-slide template with each slide divided into three closed-form sections. Each section contains an image frame at the top, a title in the center, and a five-level star rating with descriptive text at the bottom. Formatted in 16:9 widescreen ratio for optimal compatibility with modern presentation environments.
Related Products
-

Customer Type Analysis Bar Graph – Data Visualization for Customer Success
#Company Introduction #Market and Competitor Analysis #Customer Success Stories
-

User Interviews & Personas Slide – Essential Tool for Customer Analysis
#Market and Competitor Analysis #Customer Success Stories #Diagram
-

Customer Analysis with Horizontal and Vertical Bar Graphs – Market and Competitor Analysis
#Market and Competitor Analysis #Marketing Plan and Strategy #Diagram
-

Kids Horoscope Card – Customer Analysis and Success Stories
#Market and Competitor Analysis #Customer Success Stories #Diagram
