Global Market Outlook Analysis – Diagram Based Presentation
RM0500003_10
- Last Update 02/20/2025
- File Size 4.2MB
- # of Slides 2
- File Format PPTX
- Slide Ratio 16:9
- Color
Keywords
- #Content-Based Slides
- #Design-Based Slides
- #Company Introduction
- #Market and Competitor Analysis
- #Diagram
- #Other
- #Global Network
- #Market Status
- #Table
- #Standard Table
- #Map
- #16:9
- #world map PowerPoint slide
- #global network presentation
- #map diagram slide template
- #international market analysis slide
- #global business PPT download
About the Product
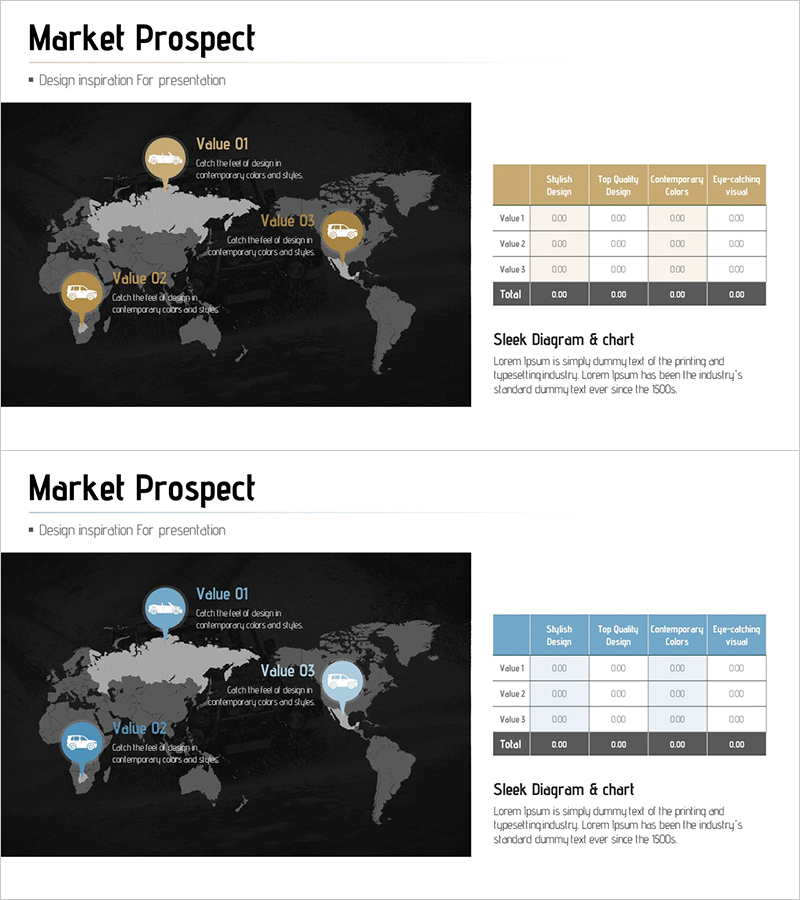
A world map-based PowerPoint slide designed to visualize global market prospects and international business strategies. The dark-background world map features three key regions marked with circular icons in gold and blue tones, accompanied by descriptive text that clearly communicates global networks, international hubs, and market distribution. A data table on the right side enables quantitative comparison analysis across regions. Formatted in 16:9 widescreen with 2 slides, all elements are fully editable for immediate use in corporate updates, competitive analysis, and market opportunity presentations.
Usage Points
-
Main Usage
Visualize global market conditions, international hub locations, and overseas business territories using a map-based layout to clearly communicate international business strategies to executives, investors, and partners. Geographic context and quantitative data are presented simultaneously through location markers on the world map.
-
How to Use
On slide 1, customize the three region markers by replacing placeholder text with your company's hub names or target markets. Update the right-side table with regional metrics such as revenue, market share, or growth rates to provide quantitative evidence. Slide 2 can be used for additional regions or detailed analysis breakdowns.
-
Recommended For
Global business strategy presentations, overseas expansion plans, international market entry proposals, multinational company profiles, international partnership negotiations, investor pitch decks, executive briefings, and consulting project deliverables.
-
Slide Structure
Slide 1: Dark-background world map with 3 circular region markers (gold and blue tones) + region names and descriptive text + right-aligned 4-column data table (5 rows). Slide 2: Identical layout for additional regions or supplementary analysis. All shapes, text, and table cells are fully editable.
Related Products
-

Media Utilization Graph – Visualizing Market Trends
#Company Introduction #Market and Competitor Analysis #Other
-

Green Energy Chart Map – Global Market Analysis
#Company Introduction #Market and Competitor Analysis #Graph
-

Global Market Entry & Data-Based Market Analysis Chart
#Company Introduction #Market and Competitor Analysis #Graph
-

Global Market Analysis – Global Network and Target Market
#Company Introduction #Market and Competitor Analysis #Diagram
