Visualizing Market Analysis with Sharp Triangular Graph
RJ0800008_23
- Last Update 08/01/2025
- File Size 0.6MB
- # of Slides 2
- File Format PPTX
- Slide Ratio 16:9
- Color
Keywords
About the Product
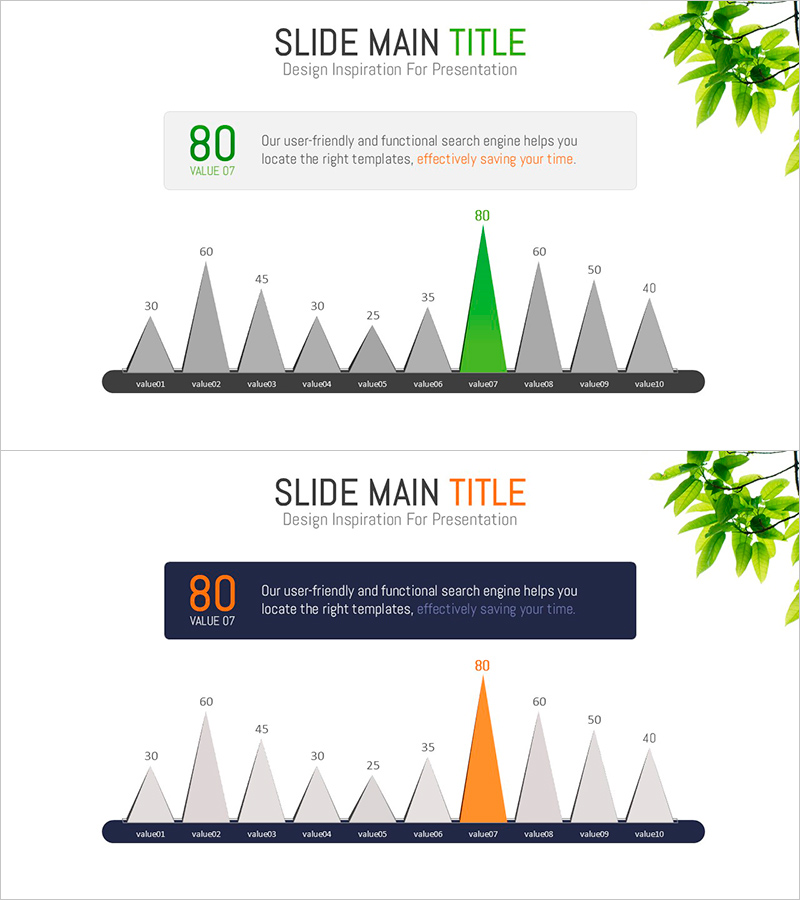
A vertical triangular graph PowerPoint slide designed for market analysis and competitive comparison presentations. This slide visualizes numerical data for 10 items using triangle heights, with the peak value highlighted in green or orange to draw immediate attention to key metrics. The gray-toned background and clear labeling make it ready to use in business presentations and reports. The 2-slide set accommodates different datasets, and the 16:9 widescreen format is optimized for modern presentation environments.
Usage Points
-
Main Usage
Represent numerical data for 10 items using triangle heights to show peak values and relative magnitudes at a glance. The green or orange highlight emphasizes key metrics and directs audience attention to critical data points in market analysis, competitor benchmarking, or performance reporting.
-
How to Use
Replace the numerical labels above each triangle with your own data and update the category names (value01–value10) at the bottom. Customize the highlight color (green or orange) to match your presentation theme, and use both slides for comparative analysis or different datasets.
-
Recommended For
Marketing professionals presenting market share analysis, sales teams comparing competitors, executives reporting performance metrics, consultants visualizing data in proposals, and academics presenting statistical findings in research presentations.
-
Slide Structure
Slide 1: Green-highlighted triangular graph with 10 items (data range 30–80) plus information box at top. Slide 2: Orange-highlighted triangular graph with identical structure and dark navy information box. Each slide includes title area, descriptive text box, and graph visualization area.
Related Products
-

Snow Mountain Theme Competitive Advantage Graph
#Product/Service Introduction #Market and Competitor Analysis #Graph
-

Garden Management Curve Graph
#Market and Competitor Analysis #Financial Plans and Performance #Graph
-

The Population Graph of Animals and Plants – Visualizing Competitive Advantage
#Business Strategy #Market and Competitor Analysis #Diagram
-

Sea Wide PowerPoint Bundled Vertical Bar Chart – Emphasizing Competitive Advantage
#Market and Competitor Analysis #Graph #Competitive Advantage
