Country-by-Country Revenue Analysis Table – Data-Driven Insights
RM0600007_14
- Last Update 02/25/2025
- File Size 0.8MB
- # of Slides 2
- File Format PPTX
- Slide Ratio 16:9
- Color
Keywords
- #Content-Based Slides
- #Design-Based Slides
- #Company Introduction
- #Market and Competitor Analysis
- #Diagram
- #Other
- #Global Network
- #Target Market
- #Table
- #Map
- #16:9
- #regional analysis PowerPoint slide
- #world map template
- #global performance comparison slide
- #regional data visualization
- #international market analysis PPT
About the Product
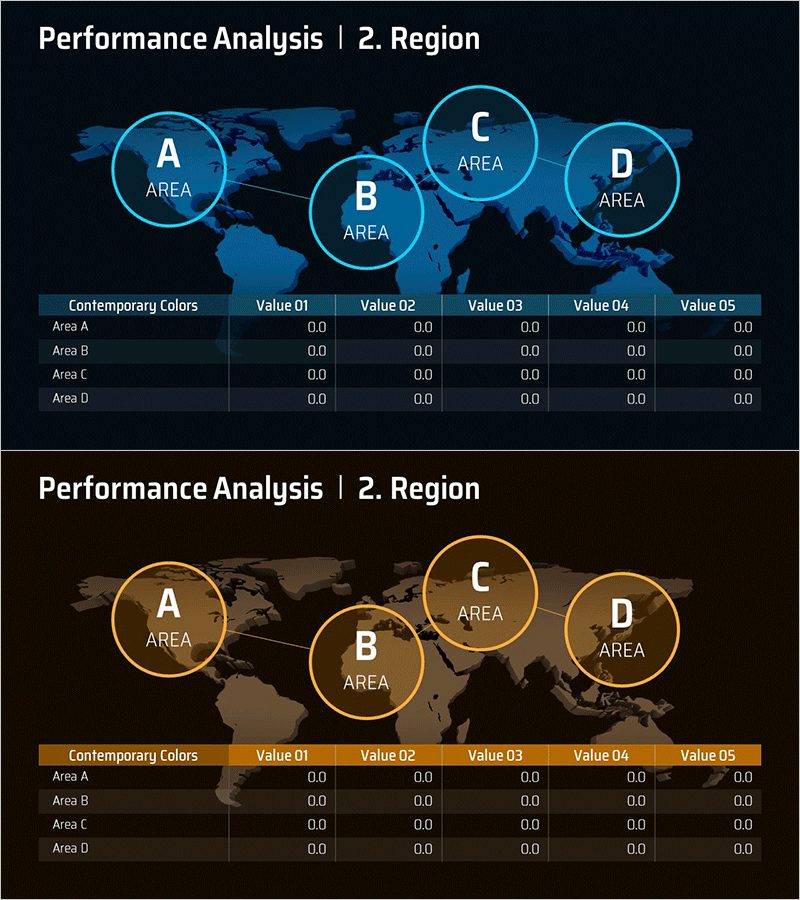
A professional PowerPoint slide for global market analysis and regional performance comparison. The slide features a world map with 4 regions (A, B, C, D) highlighted by circular borders, and a data table below with 5 performance metrics for numerical input. The dark blue background layout is ideal for international business presentations, regional revenue analysis, and global strategy documents. Two color versions (blue and gold) are provided to match your corporate brand and presentation tone. Fully editable in PowerPoint format—simply input your data to create a polished regional analysis presentation.
Usage Points
-
Main Usage
This slide enables multinational companies to compare regional sales, performance, and market share at a glance. The world map with 4 circular-highlighted regions conveys geographic location and performance simultaneously, while the data table below allows input of 5 key metrics (Value 01–05) to provide quantitative evidence and support decision-making.
-
How to Use
Use this slide in investor presentations (IR), executive briefings, and regional strategy meetings to explain global performance. Add detailed information on hover-over for each region's circular highlight, or update table values in real-time for dynamic presentations. Applicable to annual performance comparisons, quarterly trend analysis, new market entry plans, and various regional analysis contexts.
-
Recommended For
Primary audiences include C-suite executives, global marketing and sales teams, regional business managers, and investor relations professionals. Particularly effective for multinational corporations' quarterly and annual performance reports, emerging market expansion strategies, regional competitive analysis, and client reports from consulting firms and financial institutions.
-
Slide Structure
The slide comprises 2 sections: the upper 60% displays a world map background with 4 regions (A, B, C, D) emphasized by circular borders, while the lower 40% contains a data table with 'Contemporary Colors' header, 4 rows (Area A–D), and 5 columns (Value 01–05). The blue version features a dark navy background with cyan circular borders; the gold version uses a dark brown background with gold circular borders.
Related Products
-

Global Target Market Analysis Table – Visualizing Market Insights
#Company Introduction #Market and Competitor Analysis #Diagram
-

Presentation Template Visualizing Target Market Partnership Status
#Company Introduction #Market and Competitor Analysis #Diagram
-

Global Market Analysis – Global Network and Target Market
#Company Introduction #Market and Competitor Analysis #Diagram
-

Target Market Analysis by Region – Global Marketing Strategy
#Company Introduction #Market and Competitor Analysis #Diagram
