Competitor Analysis and Competitive Advantage – Red, Blue, Purple Bar Chart
RJ0400039_11
- Last Update 05/27/2025
- File Size 0.2MB
- # of Slides 2
- File Format PPTX
- Slide Ratio 16:9
- Color
Keywords
- #Content-Based Slides
- #Design-Based Slides
- #Market and Competitor Analysis
- #Graph
- #Competitor Analysis
- #Competitive Advantage
- #Horizontal Bar
- #Double Horizontal Bar
- #16:9
- #dual bar chart PowerPoint
- #competitor analysis slide
- #horizontal bar graph template
- #comparison chart PPT
- #competitive advantage presentation
About the Product
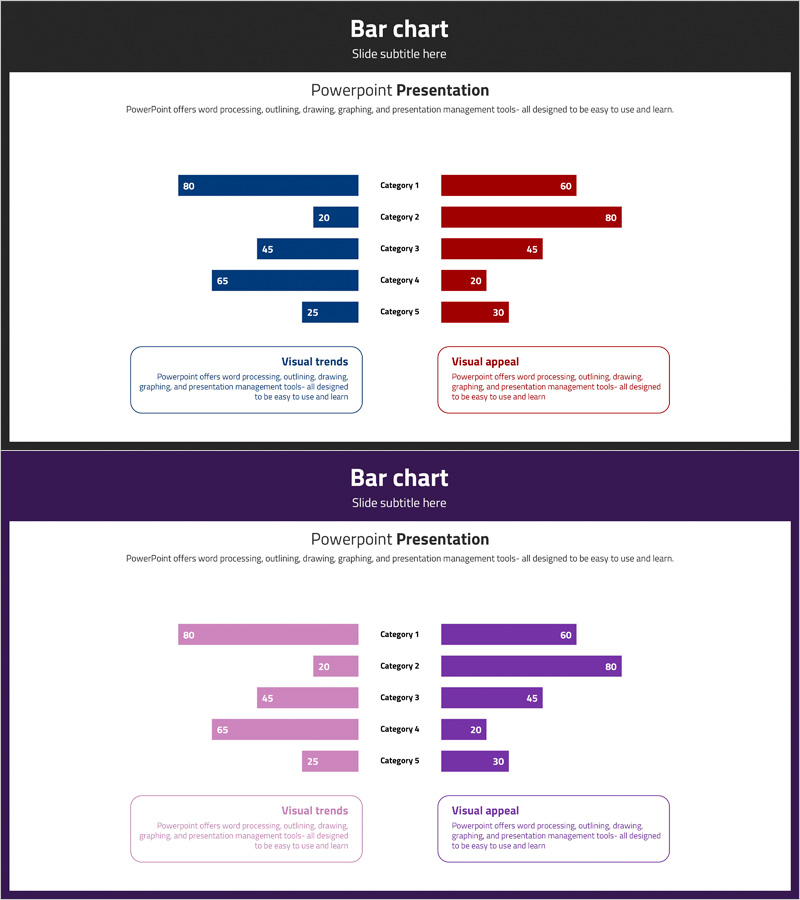
A dual bar chart PowerPoint slide designed to visualize competitor analysis and competitive advantage. The slide uses three color schemes—red, blue, and purple—to clearly contrast comparative data across five categories. The symmetrical left-right layout enables intuitive side-by-side comparison of two data series, with numerical labels on each bar for immediate presentation use. This 2-slide set offers multiple color combinations, formatted in 16:9 widescreen PPTX for universal compatibility across all presentation environments.
Usage Points
-
Main Usage
Effectively communicate competitive positioning, market analysis, and performance comparisons through symmetrical dual bar visualization. The left-right structure allows simultaneous comparison of two data groups across five categories, making competitive gaps and advantages immediately apparent.
-
How to Use
Apply this slide in strategic planning presentations, market analysis reports, and executive briefings to explain competitive landscape. Edit bar values and category labels with your own data, and customize colors to match your brand guidelines or presentation theme.
-
Recommended For
Marketing managers, strategy planners, and sales executives presenting competitive analysis findings. Ideal for new market entry discussions, product positioning strategies, and market share comparison presentations.
-
Slide Structure
Two-slide set featuring dual bar charts with different color combinations. Slide 1 uses red and blue bars; Slide 2 uses blue and purple bars. Each slide contains five categories (Category 1–5) with two symmetrical data series, numerical labels, and legend for clear data interpretation.
Related Products
-

Bar Graph for Competitor Analysis – Business Advantage
#Market and Competitor Analysis #Graph #Competitor Analysis
-

Horizontal Bar Chart for Beer Competitive Advantage Visualization
#Market and Competitor Analysis #Graph #Competitor Analysis
-

Competitor Analysis Thin Bar Graph – Visualizing Market Competitive Advantage
#Market and Competitor Analysis #Graph #Competitor Analysis
-

Competitor Analysis and Competitive Advantage Double Bar Chart
#Market and Competitor Analysis #Graph #Competitor Analysis
