Maximizing Business Strategies with the Fruit Slice Year Chart – Key to Success
RJ0800002_3
- Last Update 07/31/2025
- File Size 0.5MB
- # of Slides 2
- File Format PPTX
- Slide Ratio 16:9
- Color
Keywords
About the Product
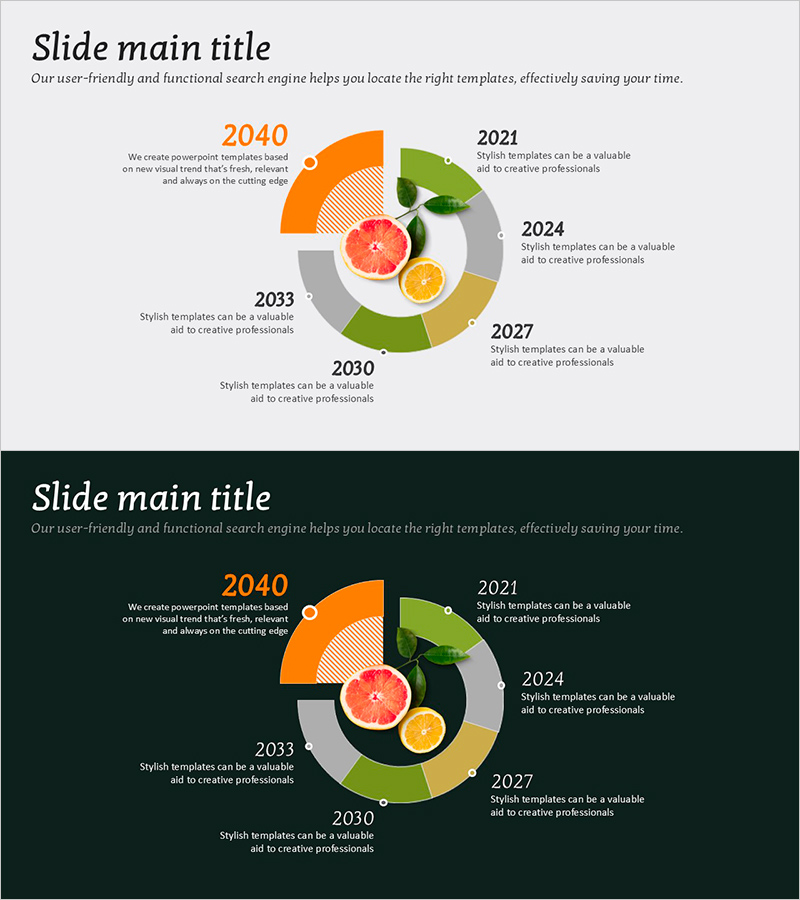
A 6-segment donut chart PowerPoint slide that visualizes business strategies across multiple years using distinct colors: orange, green, gray, and gold. The center features fruit slice imagery (orange, grapefruit, lemon) to enhance visual appeal. Each year segment includes corresponding strategy text for clear communication. The 2-slide set provides both light and dark background versions, allowing flexible adaptation to different presentation environments. Ideal for presenting annual roadmaps, phased business initiatives, and strategic milestones in corporate presentations.
Usage Points
-
Main Usage
Visualizes multi-year business strategies, phased goal achievement plans, and long-term vision roadmaps using a donut chart format. Each year segment displays key strategic initiatives as text, enabling audiences to grasp business direction and progression over time intuitively.
-
How to Use
Apply in business strategy presentations, executive reports, investor pitch decks, and strategic planning meetings. Edit the text in each year segment to reflect your specific strategies, and adjust colors as needed to align with corporate branding. Use the light background version for daytime presentations and the dark version for evening events.
-
Recommended For
Executives, business strategists, planning teams, marketing departments, consultants, and startup founders presenting medium to long-term business plans, annual objectives, and growth strategies. Particularly effective for explaining 5-7 year strategic initiatives in a phased manner.
-
Slide Structure
Donut chart divided into 6 segments representing different years (2040, 2021, 2024, 2027, 2033, 2030), each with associated strategy text. Central imagery features fruit slices (orange, grapefruit, lemon). Two versions provided: light gray background and dark gray background for flexible presentation contexts.
Related Products
-

Cluster Diagram Slide for Event Planning – Strategic Roadmap
#Company Introduction #Business Strategy #Diagram
-

Global Construction Company History – Diagram for Business Strategy
#Company Introduction #Business Strategy #Diagram
-

Plogging Route Presentation Slide – 9-Point S-Curve Timeline
#Company Introduction #Business Strategy #Corporate Social Responsibility
-

Guiding Slide Representing Future Vision – Current Status of Business
#Company Introduction #Business Vision and Strategy #Business Strategy
