Global Construction Company History – Diagram for Business Strategy
RB0700019_4
- Last Update 03/16/2025
- File Size 0.8MB
- # of Slides 2
- File Format PPTX
- Slide Ratio 4:3
- Color
Keywords
- #Content-Based Slides
- #Design-Based Slides
- #Company Introduction
- #Business Strategy
- #Diagram
- #History
- #Roadmap
- #Cluster
- #Closed Cluster Diagram
- #4:3
- #timeline diagram PowerPoint
- #closed-form diagram slide
- #company history presentation
- #global construction company PPT
- #business strategy diagram template
About the Product
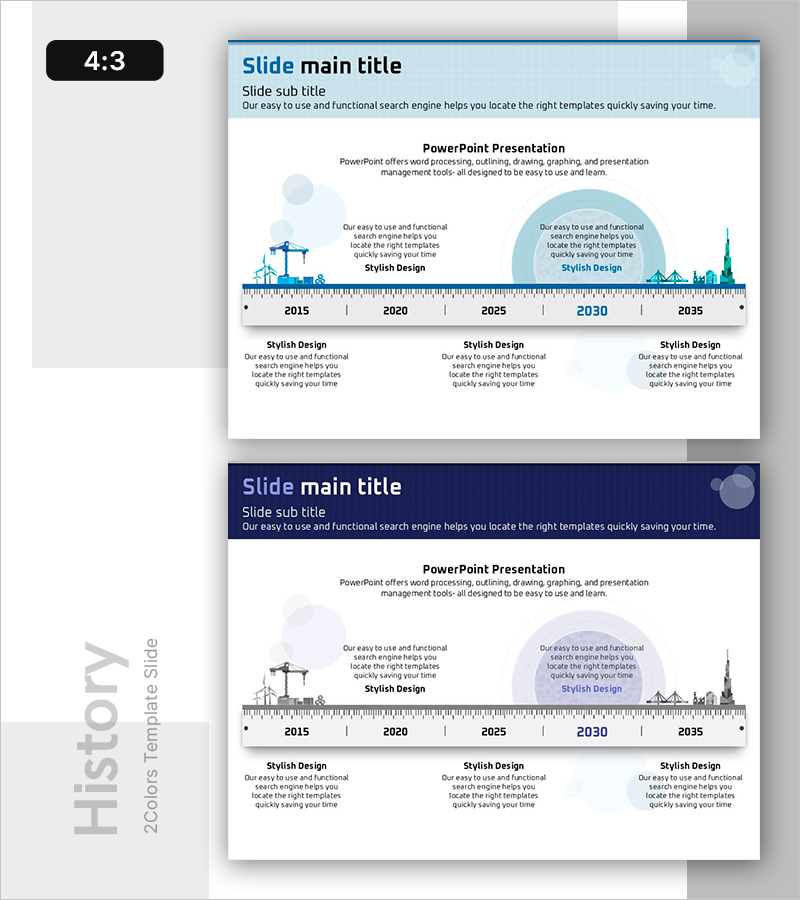
A timeline closed-form diagram PowerPoint slide that visualizes the history and business strategy of a global construction company. The horizontal ruler-style axis spans from 2015 to 2035, highlighting key milestones with construction crane and city skyline icons that emphasize industry characteristics. Circular nodes and text boxes positioned on both left and right sides present each period's core strategies and achievements, making it ideal for company profiles, business plans, and annual reports to effectively communicate corporate growth trajectories. Ready-to-edit 4:3 aspect ratio presentation with 2 slides.
Usage Points
-
Main Usage
Visualize corporate growth trajectory and major business implementation phases in timeline format to clearly communicate company vision and achievements to investors, employees, and clients. Organize large-scale construction and infrastructure projects by year to emphasize credibility and professional expertise.
-
How to Use
Insert into company profile sections covering company overview and history, business plan pages detailing strategic initiatives, or annual report sections summarizing performance. Edit node text to input actual years, project names, and performance metrics. Customize circular node colors to differentiate project categories and enhance visual organization.
-
Recommended For
Executives, marketing teams, and IR professionals in construction, real estate, and infrastructure sectors. Recommended for corporate introduction presentations, investment pitch decks, shareholder meetings, and strategic planning teams needing to visually organize long-term business plans and achievements.
-
Slide Structure
Two-slide composition featuring a light blue background on the first slide and dark navy background on the second, both with identical structural layouts. Each slide contains a horizontal timeline axis with 5 year markers (2015, 2020, 2025, 2030, 2035), construction icons, and 2 circular nodes positioned left and right with 3 text boxes beneath each node, accommodating 6 information entries per slide.
Related Products
-

Year-by-year Career Page – Roadmap for Business Growth
#Company Introduction #Business Strategy #Diagram
-

Staircase Box History Slide - Business Strategy
#Company Introduction #Business Strategy #Diagram
-

Competitor Analysis Area Graph – Business Vision and Strategy
#Company Introduction #Business Vision and Strategy #Diagram
-

Business Flow Diagram – Company History and Direction
#Company Introduction #Business Strategy #Diagram
