Sheep Illustrations and Tables for Operational Plans
RJ0800001_29
- Last Update 07/31/2025
- File Size 0.5MB
- # of Slides 2
- File Format PPTX
- Slide Ratio 16:9
- Color
Keywords
- #Content-Based Slides
- #Design-Based Slides
- #Operational Plan
- #Financial Plans and Performance
- #Diagram
- #Business Support Plan
- #Key Financial Indicators
- #Table
- #16:9
- #operational plan PowerPoint slide
- #comparison table design
- #4-column table slide
- #financial planning presentation
- #business strategy PPT
About the Product
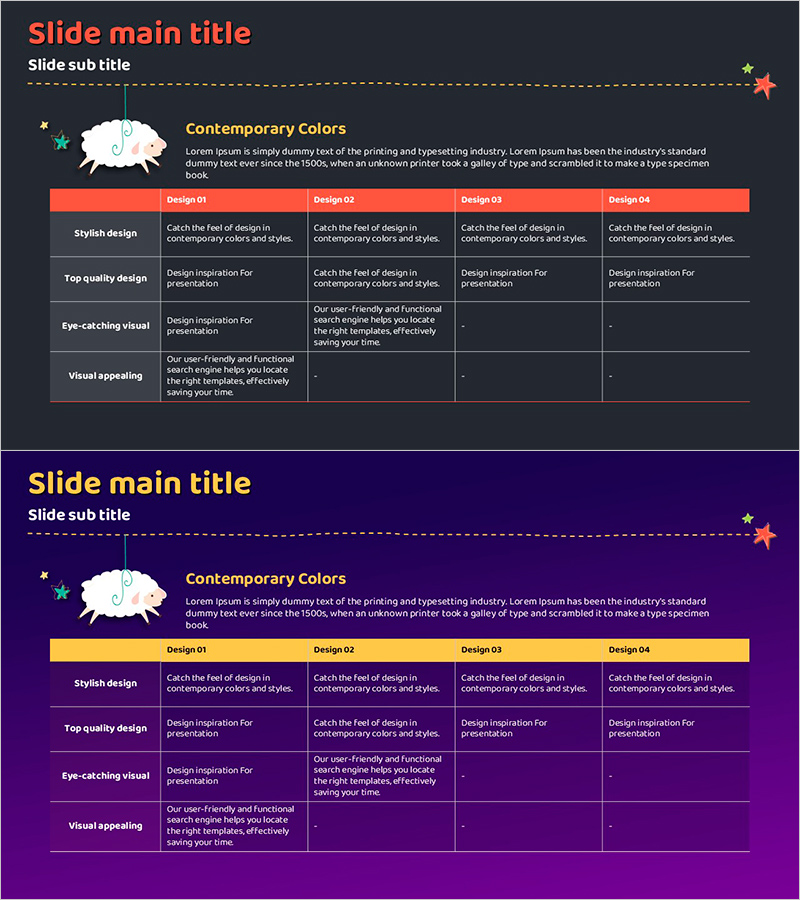
A 2-slide PowerPoint presentation optimized for operational and financial planning presentations. This deck combines a charming sheep illustration with a 4-column comparison table to enhance information delivery. Dark backgrounds (charcoal and purple) with orange and yellow accent colors create strong visual contrast, allowing each column to display categories such as stylish design, top quality, eye-catching visuals, and visual appeal. In 16:9 aspect ratio and PPTX format, it's ready for immediate editing. Perfect for company strategy presentations, departmental planning comparisons, and financial goal discussions.
Usage Points
-
Main Usage
Compare and analyze company operational plans, financial strategies, and departmental initiatives across four dimensions to support executive decision-making. Combines qualitative assessments (design style, quality, visual impact, appeal) with quantitative data for comprehensive strategy evaluation.
-
How to Use
Enter comparison subjects (Design 01-04 or Strategy A-D) in column headers and evaluation criteria in row labels. Adjust cell heights based on text length and apply accent colors (orange, yellow) to additional rows to highlight priority items.
-
Recommended For
Executives, planning teams, finance departments, and operations teams use this slide for strategy meetings, quarterly planning presentations, and departmental performance comparisons. Ideal for objective evaluation and decision-making scenarios requiring multi-option analysis.
-
Slide Structure
2-slide layout with title and subtitle areas, sheep illustration, and 4-column comparison table on each slide. Table features an orange header row and four dark-background evaluation rows with editable text cells. Available in charcoal and purple background versions.
Related Products
-

Project Funding Plan – Easy to Create Financial Planning Slide
#Financial Plans and Performance #Diagram #Capital Requirements
-

Liquidity Management and Cash Flow Forecasting Table – Clear Balance Sheet Reflecting Financial Performance
#Financial Plans and Performance #Diagram #Balance Sheet
-

Key Financial Indicators Table Chart – Presentation for Funding Plan
#Financial Plans and Performance #Diagram #Capital Requirements
-

Corporate Investment and Financing Profit Statement – Efficient Funding Plan
#Financial Plans and Performance #Diagram #Capital Requirements
