Rounding Gauge Chart for Performance Visualization – Modern Design
RJ0800001_23
- Last Update 07/30/2025
- File Size 0.4MB
- # of Slides 2
- File Format PPTX
- Slide Ratio 16:9
- Color
Keywords
About the Product
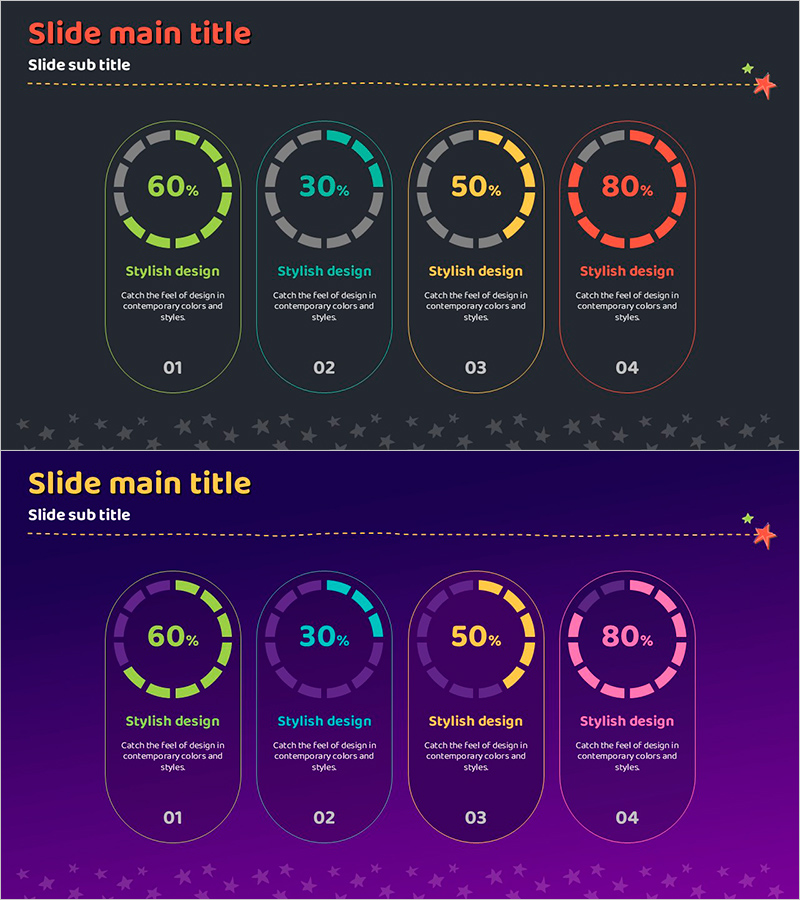
A PowerPoint slide featuring four circular gauge charts for comparing performance metrics at a glance. Set against a dark gray background, the gauges display lime, cyan, yellow, and red color schemes, each showing achievement rates (60%, 30%, 50%, 80%) in an intuitive visual format. Two layout variations are provided—dark gray and deep purple backgrounds—with descriptive text areas beneath each gauge for presenting project, departmental, or KPI performance status. Delivered in 16:9 ratio PPTX format, fully editable and ready to customize.
Usage Points
-
Main Usage
Visualize project, departmental, or team KPI achievement rates using circular gauges to display performance status at a glance. Clear color differentiation and numerical values enhance audience engagement during presentations.
-
How to Use
Input actual achievement rate percentages into the four gauge charts, then edit the descriptive text below each gauge as needed. Customize colors, number of gauges, and background to match your presentation theme. Ideal for quarterly or monthly performance comparison slides.
-
Recommended For
Executive reports, business performance presentations, team meetings, quarterly KPI reviews, marketing campaign performance analysis, and sales results updates. Suitable for project managers, marketing professionals, sales leaders, and business planning teams.
-
Slide Structure
2-slide set. Slide 1: Dark gray background with four gauges (lime, cyan, yellow, red) arranged horizontally, percentage values centered in each gauge, descriptive text area and numbering (01–04) below. Slide 2: Deep purple background with identical gauge layout. 16:9 aspect ratio, PPTX format.
Related Products
-

Budget Diagram by Item – Visual Representation of Budget Planning
#Financial Plans and Performance #Diagram #Capital Requirements
-

Business Competency Circular Diagram – Visualizing Core Strategies
#Product/Service Introduction #Business Vision and Strategy #Diagram
-

User Analysis Radial Graph – Understanding and Analyzing Customers
#Product/Service Introduction #Market and Competitor Analysis #Diagram
-

Global Corporate Vision and Goals Diagram
#Company Introduction #Business Vision and Strategy #Diagram
