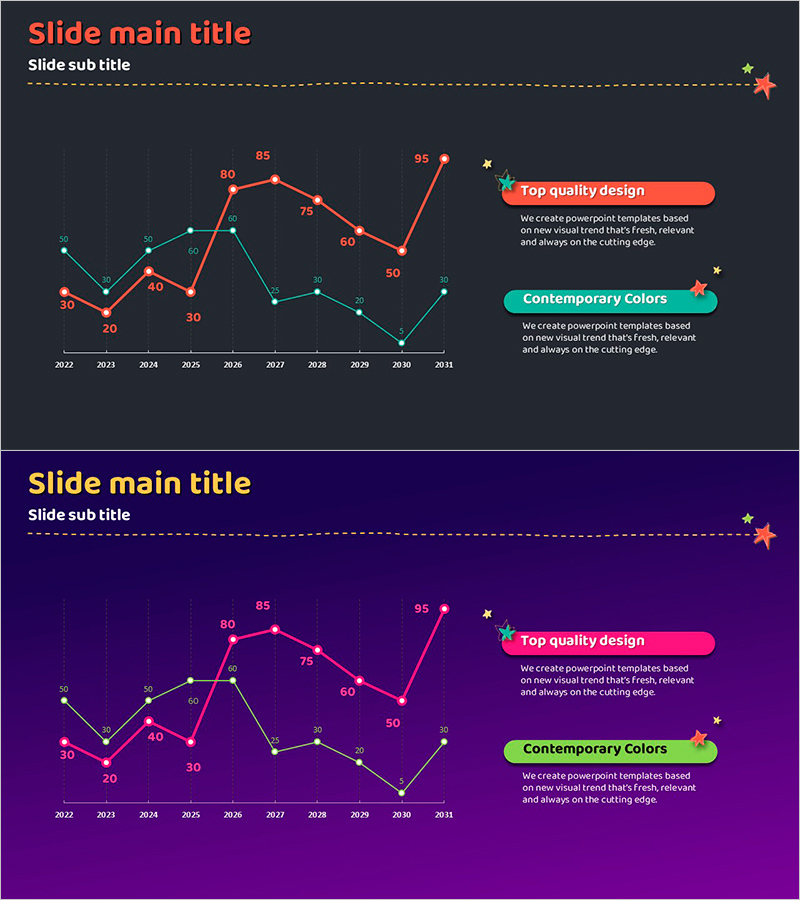
Contending Curve Chart – Essential Slide for Competitive Analysis
RJ0800001_19
- Last Update 07/30/2025
- File Size 0.4MB
- # of Slides 2
- File Format PPTX
- Slide Ratio 16:9
- Color
Keywords
About the Product
This slide features a contending curve chart optimized for visually analyzing competitive positioning in the market. With a modern and clear graph design, it allows for comparison of competitive status across years, utilizing striking red and green colors for strong visual impact. This slide is perfectly suited for business settings such as strategic meetings or marketing plan presentations. It offers easy editing capabilities to swiftly change data, with an overall editing difficulty rated as 'easy' for quick application.
Usage Points
-
Main Usage
- This template is ideal for presenting competitive analysis during strategic business discussions, allowing teams to visualize market positioning effectively.
-
How to Use
- Utilize this slide in meetings focused on market strategy development, where clear visual representations can facilitate discussions on performance and future opportunities.
-
Recommended For
- This set is particularly beneficial for marketing teams, business analysts, and executives who need to communicate competitive insights during quarterly reviews or strategic planning sessions.
-
Slide Structure
- The slides are organized to guide the audience through a comprehensive overview, starting with an introduction to the competitive landscape and moving towards detailed year-over-year comparisons.
Related Products
-

Competitor Analysis Graph & Table by Year
#Market and Competitor Analysis #Diagram #Graph
-

World Travel Two-Way Bar Graph
#Market and Competitor Analysis #Graph #Competitor Analysis
-

Vertical Bar Chart for Data Analysis Visualization – Efficiency and Practicality
#Market and Competitor Analysis #Graph #Competitor Analysis
-

Competitor Revenue Analysis Graph
#Market and Competitor Analysis #Graph #Competitor Analysis
