Graph Slide Visualizing Changes in Insomnia Index
RJ0800001_11
- Last Update 07/30/2025
- File Size 0.6MB
- # of Slides 2
- File Format PPTX
- Slide Ratio 16:9
- Color
Keywords
About the Product
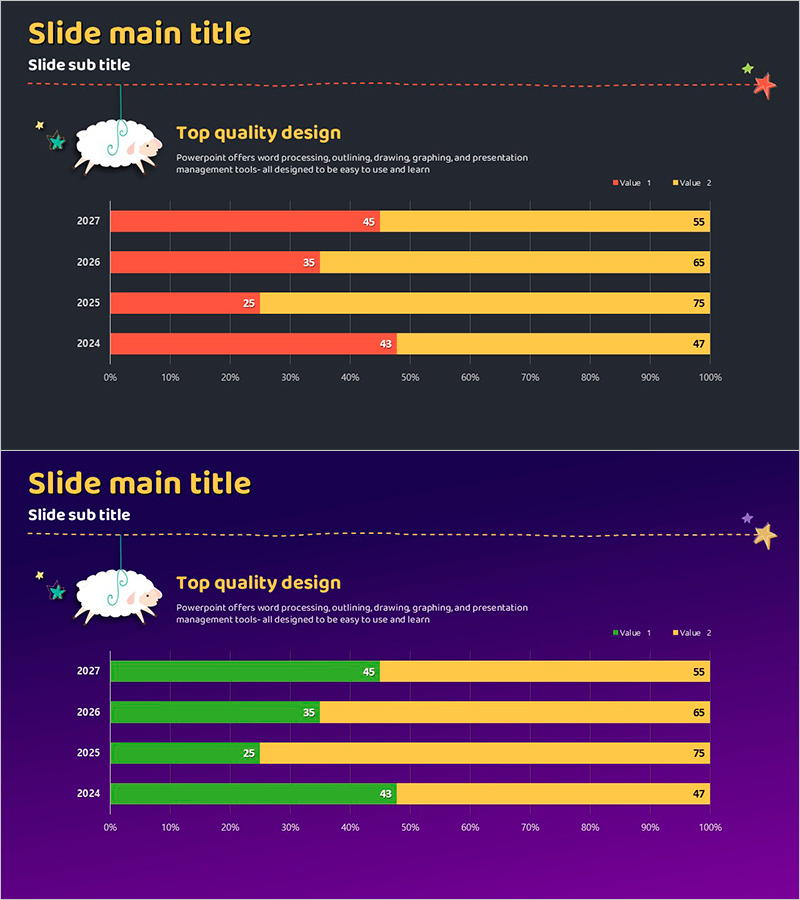
A PowerPoint slide visualizing insomnia index changes across four years (2024–2027) using a horizontal bar chart. Data is presented in two series (red and yellow) with numeric labels displayed on each bar for precise value communication. The dark gray background contrasts with the yellow title and colorful bars, ensuring high readability during presentations. This 2-slide PPTX template is ready for immediate use in medical, statistical, and research presentations.
Usage Points
-
Main Usage
Designed to clearly compare and analyze year-over-year data trends. Beyond insomnia metrics, it accommodates sales figures, market share, performance indicators, and other time-series data across two distinct categories, with numeric labels ensuring precise value communication.
-
How to Use
Ideal for medical and healthcare research presentations, statistical analysis reports, and business performance briefings. Simply edit the bar colors, values, and years to match your data for immediate deployment. The dark background maintains excellent visibility on large projection screens.
-
Recommended For
Healthcare professionals, statisticians, data scientists, marketing managers, and executives presenting time-series data. Suitable for academic presentations, corporate meetings, policy briefings, and any scenario requiring persuasive data-driven communication.
-
Slide Structure
Two-slide layout: the first features a dark gray background with yellow title and decorative icons; the second displays a horizontal bar chart with four years (2027–2024) and two data series (red and yellow bars) per year, with numeric values (45, 55, 35, 65, 25, 75, 43, 47) labeled on each bar.
Related Products
-

Natural Environment Satisfaction Graph – Market and Customer Analysis
#Market and Competitor Analysis #Graph #Customer Analysis
-

Competitor Progress Comparison Analysis Graph – Essential Tool for Market Analysis
#Market and Competitor Analysis #Graph #Competitor Analysis
-

Plastic Waste Emission PowerPoint Slide – Donut Chart
#Market and Competitor Analysis #Corporate Social Responsibility #Graph
-

Curved Theme Purple Template Donut Chart – A Stylish Choice for Market Analysis
#Company Introduction #Market and Competitor Analysis #Graph
