Visual Diagram Highlighting Expected Effects – Strategy for Achieving Business Goals
RM0800012_8
- Last Update 03/01/2025
- File Size 5.7MB
- # of Slides 2
- File Format PPTX
- Slide Ratio 16:9
- Color
Keywords
- #Content-Based Slides
- #Design-Based Slides
- #Business Vision and Strategy
- #Business Strategy
- #Diagram
- #Business Strategy
- #Financial Outlook & Expected Impact
- #Cluster
- #Spread
- #Combination Diagram
- #Centralized Diagram
- #16:9
- #radial diagram PowerPoint
- #business goal strategy slide
- #two-node diagram template
- #expectation effectiveness presentation
- #strategic planning slide template
About the Product
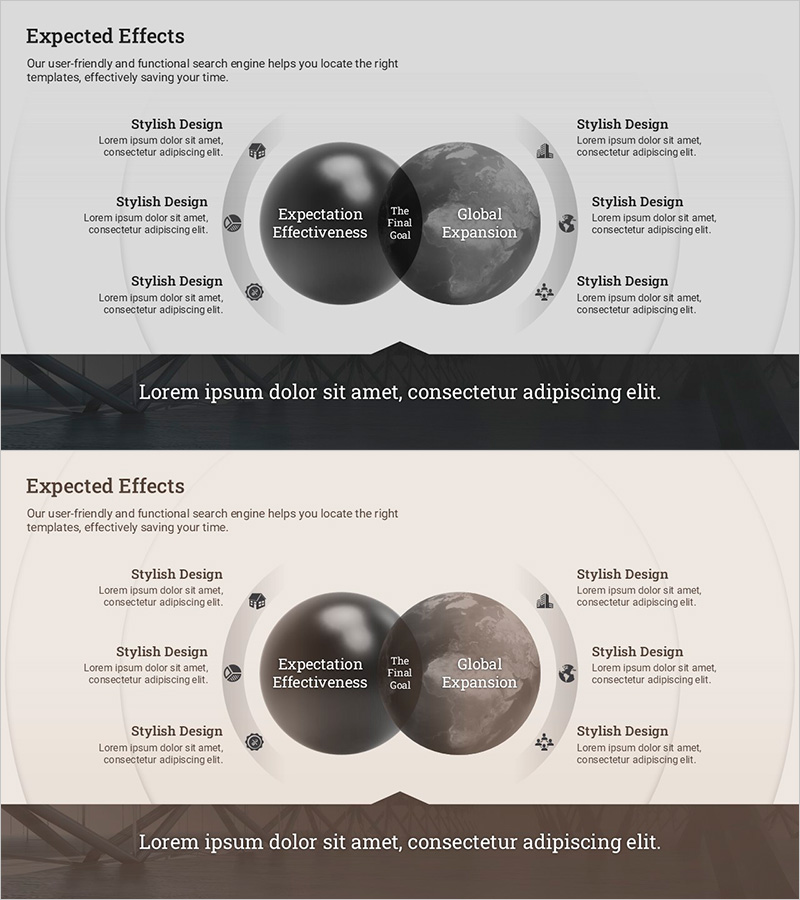
A radial diagram PowerPoint slide that visually represents expected effects and final business goals in a two-node structure. The left circular node displays 'Expectation Effectiveness,' while the right node shows 'The Final Goal' and 'Global Expansion,' clearly communicating the core elements of business strategy. Six icon-based text boxes arranged symmetrically on both sides allow detailed execution strategies to be highlighted, while dark gray gradient circles and white typography enhance professionalism. This 16:9 two-slide set is ready for immediate editing and ideal for executive reports, strategy presentations, and business plan pitches.
Usage Points
-
Main Usage
Structurally visualize management strategy, business objectives, and expected outcomes to clearly communicate with executives, team members, and stakeholders. The radial diagram structure intuitively expresses the relationship between core goals and detailed execution strategies, supporting credible communication in business reports, strategy presentations, and investor briefings.
-
How to Use
Enter expected effects in the left circular node and final goals in the right node, then fill the six text boxes on both sides with detailed execution strategies, departmental roles, and performance metrics. Customize icon and text colors to match organizational branding, and add key messages to the bottom black banner to align with presentation context.
-
Recommended For
Executives, strategy planning teams, business development teams, marketing managers, and project managers can use this for management meetings, strategy planning presentations, business plan reports, investor pitches, and organizational restructuring announcements. It is particularly effective when explaining goal achievement pathways step by step.
-
Slide Structure
Two-slide set with each slide featuring two symmetrical circular nodes (approximately 120px diameter each) and six icon-based text boxes total (three on each side, approximately 80×80px each). Nodes use dark gray gradient fill, text boxes have light gray backgrounds with icons and text, and a black banner (approximately 60px height) is positioned at the bottom.
Related Products
-

Definition and Goals of Education – Sustainable Development
#Business Vision and Strategy #Diagram #Business Strategy
-

Overlapping Spread Business Strategy Diagram
#Business Vision and Strategy #Diagram #Business Strategy
-

Business Vision and Strategy with Venn Diagram – Efficient Cluster Representation
#Business Vision and Strategy #Business Strategy #Diagram
-

Coffee Bean Overlap Diagram – Business Strategy and Service Composition
#Business Vision and Strategy #Technical Approach #Diagram
