Research and Development Area Diagram – Vision of Innovation
RJ0700028_9
- Last Update 07/30/2025
- File Size 0.9MB
- # of Slides 2
- File Format PPTX
- Slide Ratio 16:9
- Color
Keywords
- #Content-Based Slides
- #Design-Based Slides
- #Company Introduction
- #Business Vision and Strategy
- #Diagram
- #Business Areas
- #Business Vision
- #Cluster
- #Closed Cluster Diagram
- #16:9
- #cluster diagram PowerPoint
- #4-item diagram slide
- #R&D vision PowerPoint template
- #closed-form diagram
- #business vision slide design
About the Product
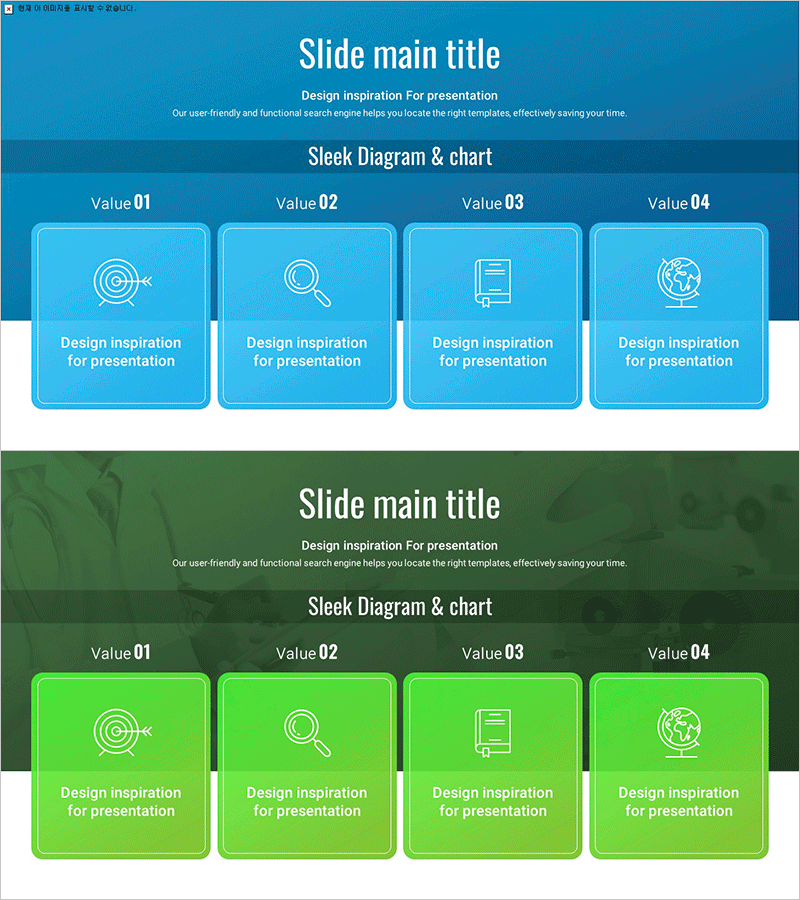
A cluster diagram PowerPoint slide presenting core R&D vision through four key items with a closed-form structure radiating from a central concept. Each item features an icon and text area, arranged in light blue boxes against a dark blue background for clear visual hierarchy. This slide effectively communicates business vision, strategic elements, and innovation points in presentations and planning documents. Delivered in 16:9 format with 2 slides, fully editable and ready to customize.
Usage Points
-
Main Usage
Visualizes core R&D vision, innovation strategy, and business objectives by organizing them into four key elements. The center-focused structure emphasizes the core message while clearly conveying the role and relationship of each component.
-
How to Use
Use in planning documents, business plans, and investor pitch decks within the R&D strategy section. Replace icons and text in each box with your organization's actual vision elements—such as technological innovation, talent, investment, and partnerships—to create a customized presentation.
-
Recommended For
R&D managers, technology planning teams, business development departments, and investor relations professionals presenting innovation strategies, R&D roadmaps, and technology vision to executives, investors, and partners.
-
Slide Structure
2-slide set. Slide 1: Dark blue background with four light blue boxes, each containing an icon and text area. Slide 2: Identical layout in green color variant. Each box is independently editable; icons, text, and background colors can all be customized.
Related Products
-

Business Area Closure Diagram – Clear Information Delivery and Visual Impact
#Company Introduction #Product/Service Introduction #Diagram
-

Pill Key Ingredients Diagram – Business Vision and Strategy
#Business Vision and Strategy #Diagram #Business Vision
-

Oriental Medicine Business Area Diagram – Visualization of Vision and Strategy
#Company Introduction #Business Vision and Strategy #Diagram
-

Spaceship Configuration Contents PowerPoint Template – Scientific Approach and Creativity
#Company Introduction #Product/Service Introduction #Diagram
