Clock Image Shape Graph for Business Areas and Sectors
RJ0300050_12
- Last Update 05/01/2025
- File Size 1.6MB
- # of Slides 2
- File Format PPTX
- Slide Ratio 16:9
- Color
Keywords
- #Content-Based Slides
- #Design-Based Slides
- #Company Introduction
- #Business Introduction
- #Diagram
- #Graph
- #Business Areas
- #Business Areas
- #Cluster
- #Circles
- #Closed Cluster Diagram
- #Pie Chart
- #16:9
- #clock-shaped pie chart PowerPoint
- #circular graph slide template
- #business areas visualization
- #percentage data chart
- #4-segment pie chart design
About the Product
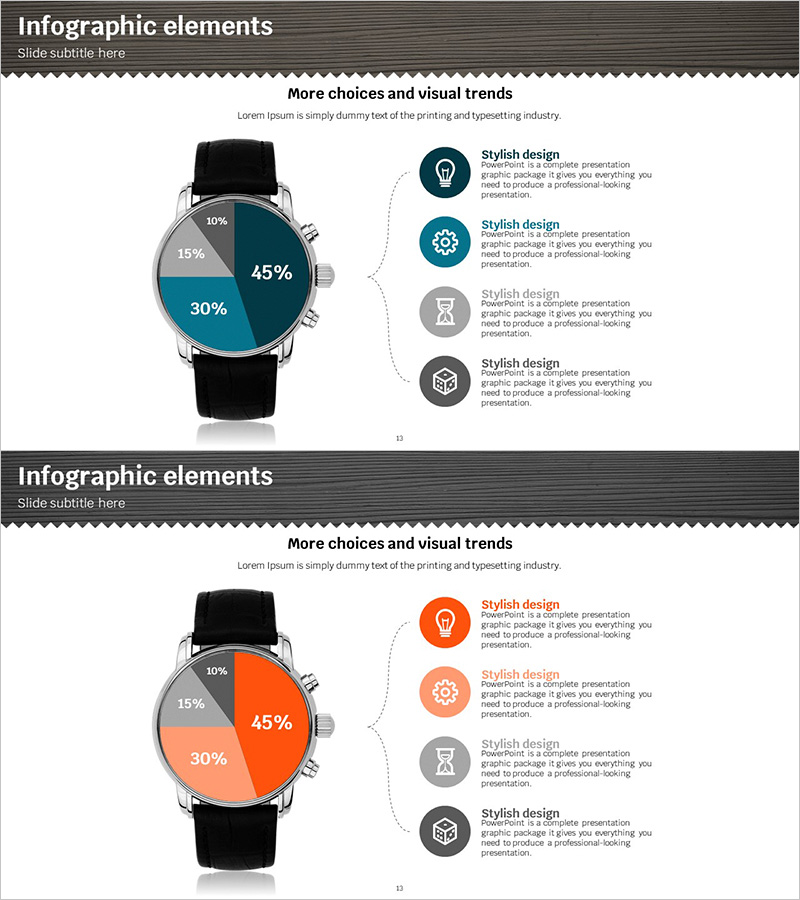
A unique PowerPoint slide featuring a clock-shaped pie chart that visually represents business divisions and market segments. The circular graph is divided into four segments (45%, 30%, 15%, 10%) and framed with a black watch border, creating a distinctive design element. The color scheme combines navy blue and gray tones, establishing a professional atmosphere suitable for business presentations. The right side displays four circular icons with accompanying text descriptions connected by dotted lines, effectively communicating detailed information for each segment. This 2-slide template is provided in 16:9 widescreen PPTX format.
Usage Points
-
Main Usage
Visually represent ratio-based data such as business portfolio composition, revenue breakdown, market share distribution, or organizational structure using an eye-catching clock-shaped pie chart. The distinctive design captures audience attention while simultaneously conveying numerical values and detailed descriptions for each segment.
-
How to Use
Apply this slide in company profile presentations for business division introductions, quarterly performance reports, investor pitch decks for revenue composition analysis, and marketing strategy documents for market analysis sections. Simply edit the segment percentages to match your actual data and input relevant descriptions in the text areas on the right.
-
Recommended For
Ideal for executives, business development teams, marketing professionals, finance teams, and consultants who need to present data-driven insights. Particularly effective when emphasizing business portfolio diversity or explaining market share fluctuations.
-
Slide Structure
A clock-shaped pie chart occupies the left side, divided into 4 segments (45%, 30%, 15%, 10%). The right side features 4 circular icons (lightbulb, gear, hourglass, cube) with corresponding text description areas connected by dotted lines. Two color variations are included: navy-gray and orange-gray versions.
Related Products
-

Strategic Element Relationship Map – Business Insights
#Company Introduction #Business Introduction #Diagram
-

Global Business Area Diagram – Overview of Business Introduction
#Company Introduction #Business Introduction #Diagram
-

Business Areas and Sectors Diagram – Visualizing Business Domains
#Company Introduction #Business Introduction #Diagram
-

SNS Business Circular Diagram - A Symbol of Collaboration and Growth
#Company Introduction #Business Introduction #Diagram
