Blue Green Analysis Chart – Intuitive Financial Performance
RJ0700028_19
- Last Update 07/30/2025
- File Size 0.5MB
- # of Slides 2
- File Format PPTX
- Slide Ratio 16:9
- Color
Keywords
- #Content-Based Slides
- #Design-Based Slides
- #Financial Plans and Performance
- #Diagram
- #Income Statement
- #Key Financial Indicators
- #Table
- #16:9
- #financial analysis table PowerPoint
- #financial data presentation slides
- #income statement PPT template
- #financial metrics comparison slide
- #blue green table design
About the Product
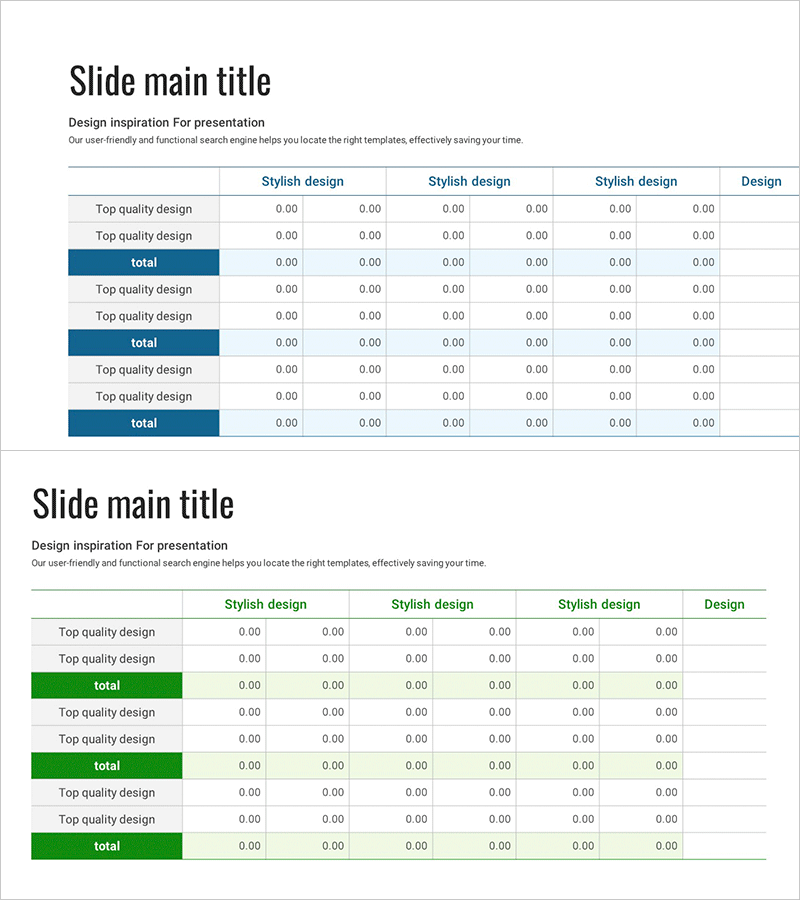
A 2-slide PowerPoint presentation designed to express financial performance and key metrics intuitively. The table layout is divided into blue and green sections, enabling clear comparison and analysis of income statements, financial indicators, and performance data. Each slide features a title area and a multi-row, multi-column data table with pre-formatted input fields for immediate use. This PPT slide template is optimized for investor presentations, financial reports, and executive briefing materials.
Usage Points
-
Main Usage
This slide is designed to visually compare and analyze financial data and performance indicators. The table structure divided by blue and green colors enables clear presentation of income statements, key financial metrics, and quarterly or annual performance comparisons.
-
How to Use
Enter financial figures, item names, and comparison targets into each table cell. Write your analysis topic in the title area (e.g., quarterly revenue status, profit trends), fill in the table rows and columns with data, and the slide is ready for presentation use.
-
Recommended For
Recommended for CFOs, finance managers, and executives presenting financial performance at investor briefings, shareholder meetings, and executive review sessions. Also suitable for financial analysis reports, the financial section of business plans, and quarterly earnings presentations.
-
Slide Structure
Composed of 2 slides, each featuring a title area at the top and a multi-row, multi-column data table at the bottom. The first slide contains three comparison table sections, while the second slide features three additional analysis table sections.
Related Products
-

Income Statement Table Slide – Clear Financial Analysis
#Financial Plans and Performance #Diagram #Income Statement
-

Robot Business Revenue and Sales Analysis Table – A Systematic Approach to Financial Planning
#Financial Plans and Performance #Diagram #Income Statement
-

Income Statement Table – Clearly Presenting Financial Plans and Performance
#Financial Plans and Performance #Diagram #Income Statement
-

Income Statement Table - Clear and Professional Data
#Financial Plans and Performance #Diagram #Income Statement
