Research and Development Overview Diagram – Innovation and Progress
RJ0700028_13
- Last Update 07/30/2025
- File Size 2.4MB
- # of Slides 2
- File Format PPTX
- Slide Ratio 16:9
- Color
Keywords
- #Content-Based Slides
- #Design-Based Slides
- #Company Introduction
- #Product/Service Introduction
- #Diagram
- #Company Overview
- #Program Introduction
- #Cluster
- #Closed Cluster Diagram
- #Chain Diagram
- #16:9
- #circular diagram PowerPoint
- #5-stage cycle diagram
- #R&D process PowerPoint
- #process flow diagram slide
- #how to create cycle diagram in PowerPoint
About the Product
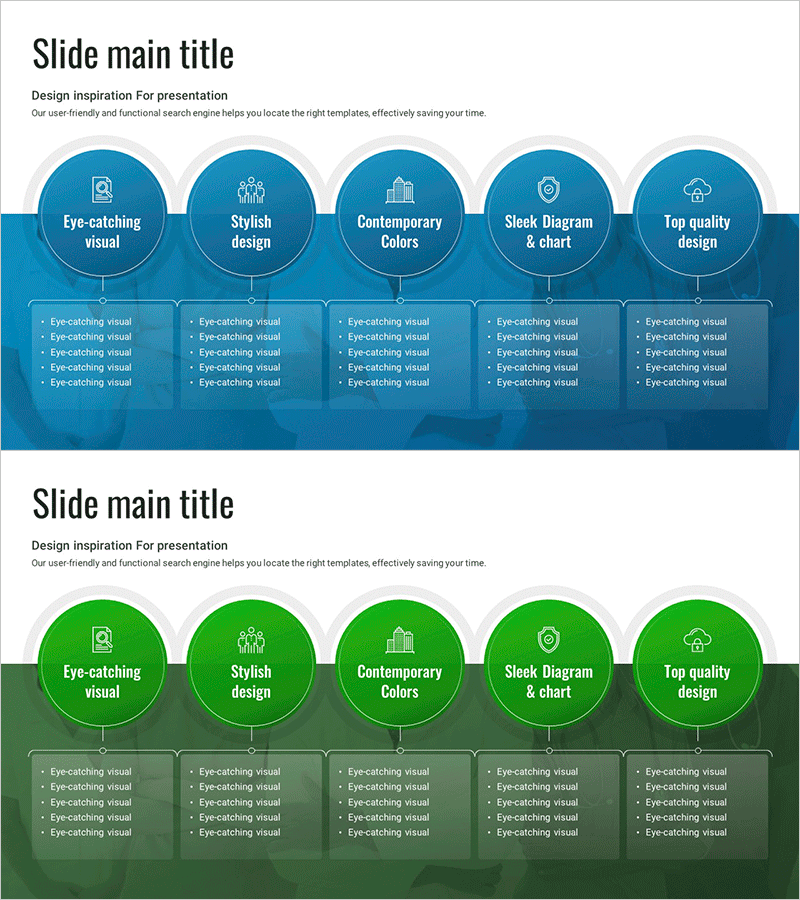
A 5-stage circular diagram PowerPoint slide designed to visualize research and development processes and innovation cycles. The cycle structure with circular nodes and connecting lines clearly represents sequential workflow and continuous improvement loops. Dark blue background with white circular nodes and icons emphasizes each stage's core concept. Text areas below each node allow detailed descriptions, making it immediately applicable to presentations, planning documents, and reports. The 2-slide set includes color variations (blue and green) for flexible brand customization.
Usage Points
-
Main Usage
Visualizes research and development processes, innovation cycles, continuous improvement systems, and project progression stages. Five circular nodes connected in a cycle structure clearly convey repetitive processes and feedback loops, enabling audiences to understand each stage's role and interdependencies at a glance.
-
How to Use
Enter stage names (planning, development, testing, improvement, completion, etc.) in each circular node and add detailed content in the text areas below. During presentation, explain each stage sequentially while emphasizing the cycle's continuity. Customize colors and icons to match organizational branding.
-
Recommended For
Ideal for R&D department project status reports, technology innovation strategy presentations, product development process explanations, quality management cycle demonstrations, and organizational improvement plan presentations. Suitable for internal meetings and external presentations by executives, team leaders, project managers, and technical specialists.
-
Slide Structure
2-slide set. Each slide features 5 circular nodes arranged clockwise in a cycle diagram with 5 text boxes at the bottom. Connecting lines and arrows between nodes indicate process flow, while icons in each node visualize stage-specific concepts. Two color variations (blue and green) are provided for flexible customization.
Related Products
-

Triangle Pattern Wide Table PPT Template – Ideal for Company and Service Introduction
#Company Introduction #Product/Service Introduction #Diagram
-

Business Management Goals Slide – Clear Goal Setting
#Company Introduction #Product/Service Introduction #Diagram
-

Introduction to Business Core Values and Direction – Cluster and Closed Diagram
#Company Introduction #Business Introduction #Diagram
-

Scientific Closed Diagram – Cluster Type Connection Structure
#Company Introduction #Diagram #Company Overview
