AI Business Market Analysis Bar Graph – Key Statistics and Insights
RJ0700025_14
- Last Update 07/29/2025
- File Size 3.4MB
- # of Slides 2
- File Format PPTX
- Slide Ratio 16:9
- Color
Keywords
About the Product
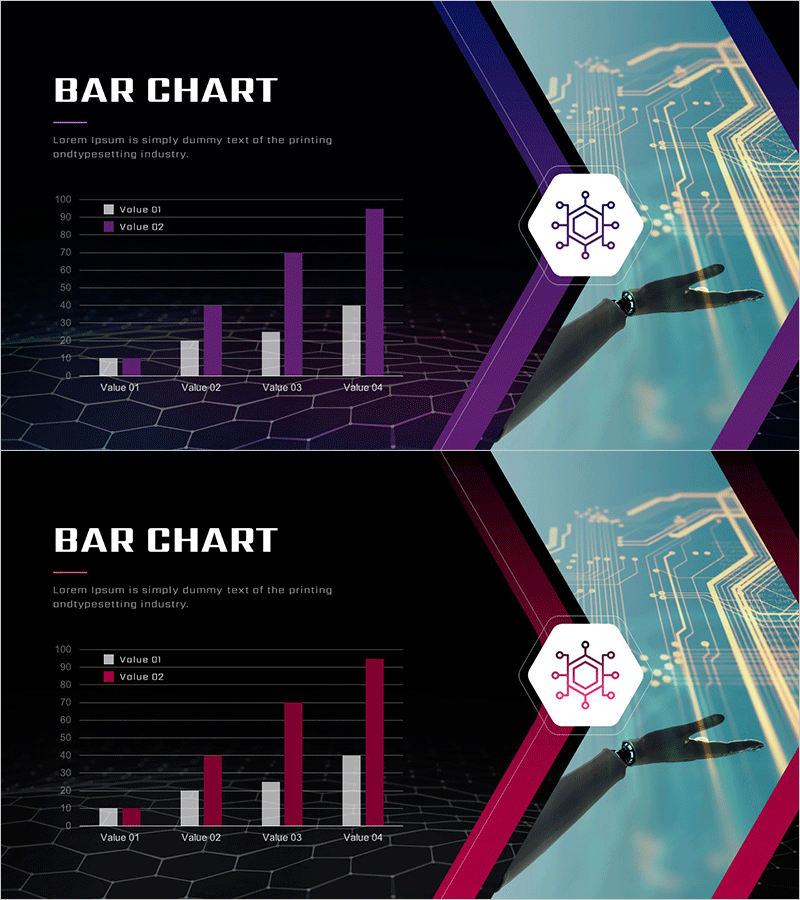
A 2-slide grouped bar chart PowerPoint template designed for AI business market analysis presentations. Available in two color schemes—blue and magenta—each slide displays 4 items with 2 data series for comparative analysis. The dark background with technology circuit patterns and purple accent frames creates a professional IT and AI-focused aesthetic. Clear legend labels, gridlines, and numeric axes enable immediate use for competitive analysis, market trends, and key statistics visualization. Delivered in 16:9 widescreen PPTX format, fully editable in all presentation software.
Usage Points
-
Main Usage
Ideal for AI and technology sector market analysis presentations where competitive performance, market size, and key metrics need to be compared across two data series. The blue and magenta color differentiation clearly distinguishes between datasets, while the dark tech-themed background reinforces credibility in IT and AI contexts.
-
How to Use
Simply replace the bar heights and legend with your own data values. Input two data points for each of the 4 items (Value 01–04) and customize the title and descriptive text as needed. Select your preferred color scheme (blue or magenta) to align with your presentation theme.
-
Recommended For
IT and AI company market analysis presentations, technology consulting competitive analysis reports, startup investor pitch decks, data analytics team quarterly performance reviews, marketing department market trend analysis, and enterprise technology strategy briefings.
-
Slide Structure
2-slide set. Each slide presents 4 items (Value 01–04) with 2 data series displayed as grouped horizontal bars. Includes legend, 0–100 numeric axis, gridlines, and a technology icon with circuit pattern background on the right side.
Related Products
-

Clustered Vertical Bar Graph for Market Analysis – Data Insights
#Market and Competitor Analysis #Graph #Competitor Analysis
-

Market Analysis Bundle Vertical Bar Graph – Effective Data Visualization
#Market and Competitor Analysis #Graph #Competitor Analysis
-

Competitor Brand Product Comparison Analysis Graph
#Market and Competitor Analysis #Graph #Competitor Analysis
-

Performance Analysis Table Slide – Market and Competitor Analysis
#Market and Competitor Analysis #Diagram #Graph
