Data Visualization Using Line Chart – Modern Design
RJ0700024_28
- Last Update 07/28/2025
- File Size 3.1MB
- # of Slides 2
- File Format PPTX
- Slide Ratio 16:9
- Color
Keywords
About the Product
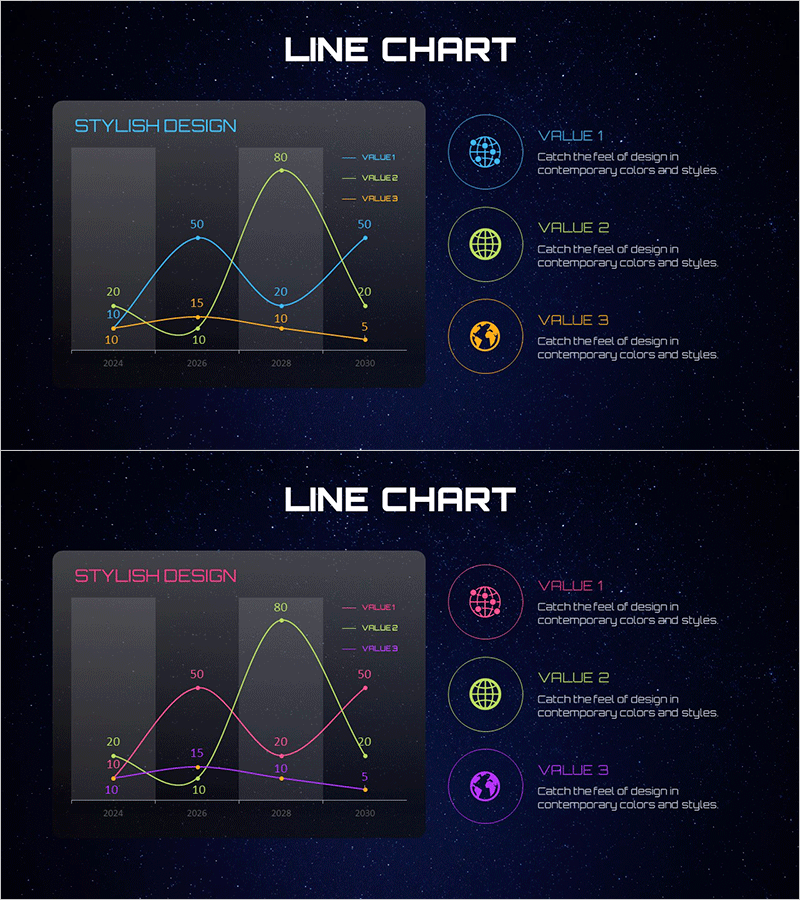
A 2-slide PowerPoint template featuring multi-series line charts tracking data changes from 2024 to 2030. The dark blue background displays three data series in cyan, yellow, and orange lines, visualizing complex trends with precision. Each slide includes data labels, legend, and icon descriptions for immediate use in business presentations. The 16:9 widescreen format is optimized for comparing sales volume, customer satisfaction, market share, and other time-series metrics.
Usage Points
-
Main Usage
Clearly compare and analyze changes in time-series data across multiple metrics. Simultaneously display sales trends, customer satisfaction scores, market share, and performance indicators to support data-driven decision-making.
-
How to Use
Apply to quarterly business reports, performance presentations, marketing analysis documents, and financial results briefings. Use the legend and data labels to enhance audience comprehension of historical performance and future projections.
-
Recommended For
Finance teams, marketing departments, sales teams, and executives preparing performance reports. Quarterly and annual presentation leads, market analysts comparing competitor data, researchers requiring academic data visualization.
-
Slide Structure
Slide 1: Three data series (VALUE1, VALUE2, VALUE3) plotted across four time points (2024–2030) with grid lines, axes, and numeric labels on the left. Right side features three circular icons with descriptive text for each series. Slide 2: Identical structure with color variation (pink, yellow, purple series).
Related Products
-

Project Market Environment Analysis Chart – Powerful Competitive Strategy
#Market and Competitor Analysis #Graph #Competitor Analysis
-

Competitor Analysis Broken Line Graph
#Market and Competitor Analysis #Graph #Competitor Analysis
-

Virus Analysis Broken Line Graph – Market and Competitor Analysis
#Market and Competitor Analysis #Graph #Competitor Analysis
-

Line Graph and Clustered Column Graph – Essential for Competitor Analysis
#Market and Competitor Analysis #Graph #Competitor Analysis
